Steve Smith

On Tech

Page 3 of 10

Implementing You Build It You Run It at scale

How can You Build It You Run It at scale be implemented? How can support costs be balanced with operational incentives, to ensure multiple teams can benefit from Continuous Delivery and operability at scale?

This is part of the Who Runs It series.

Introduction

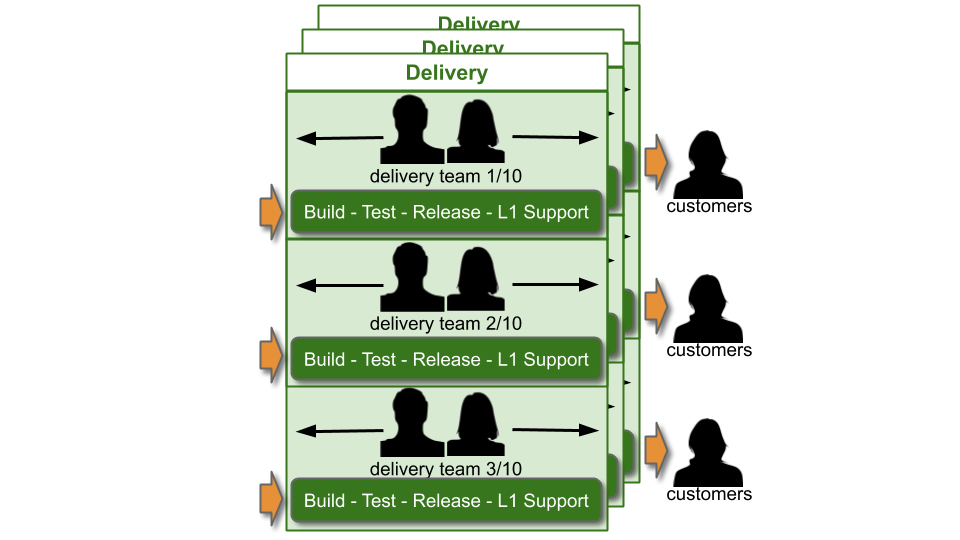
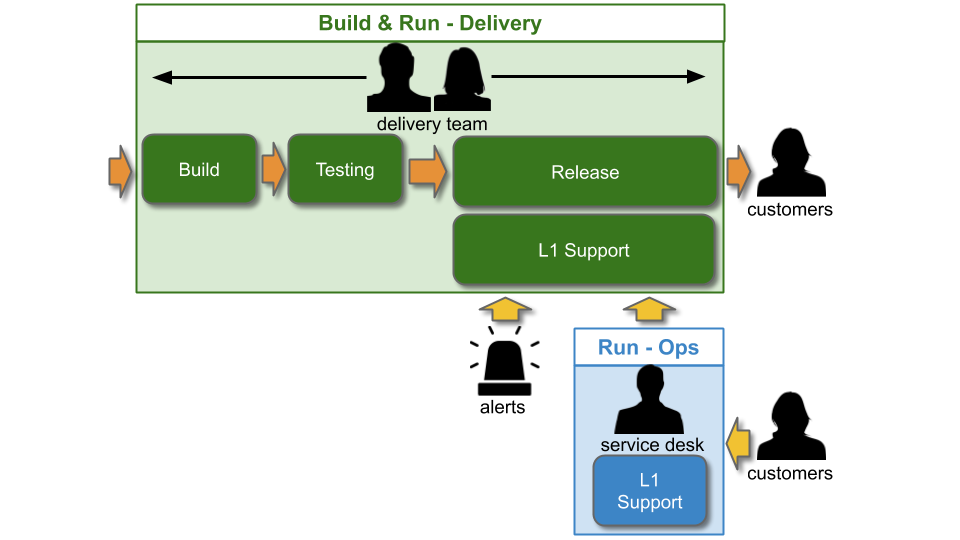
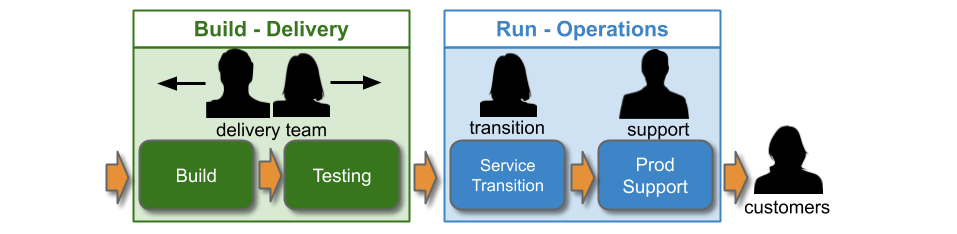
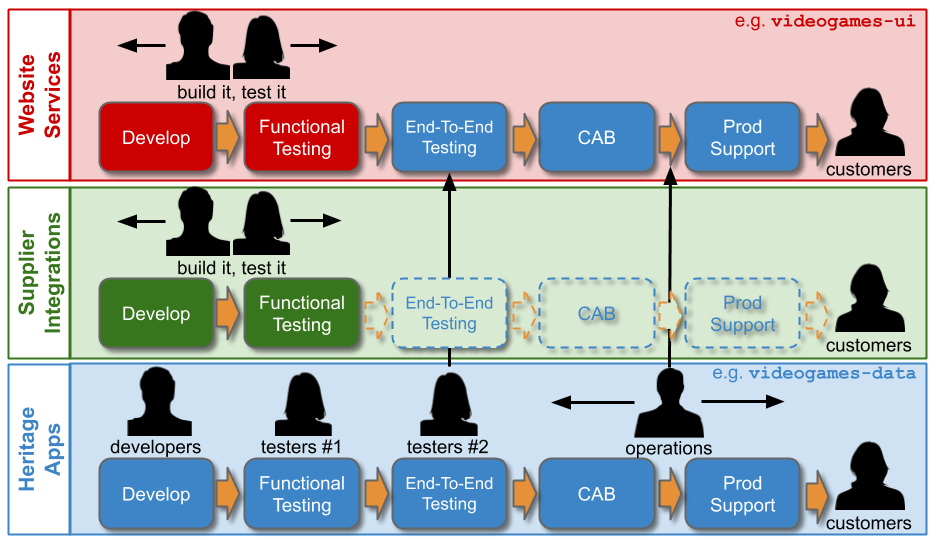
Traditionally, an IT As A Cost Centre organisation with roots in Plan-Build-Run will have Delivery teams responsible for building applications, and Operations teams responsible for deployments and production support. You Build It You Run It at scale fundamentally changes that organisational model. It means 10+ Delivery teams are responsible for deploying and supporting their own 10+ applications.

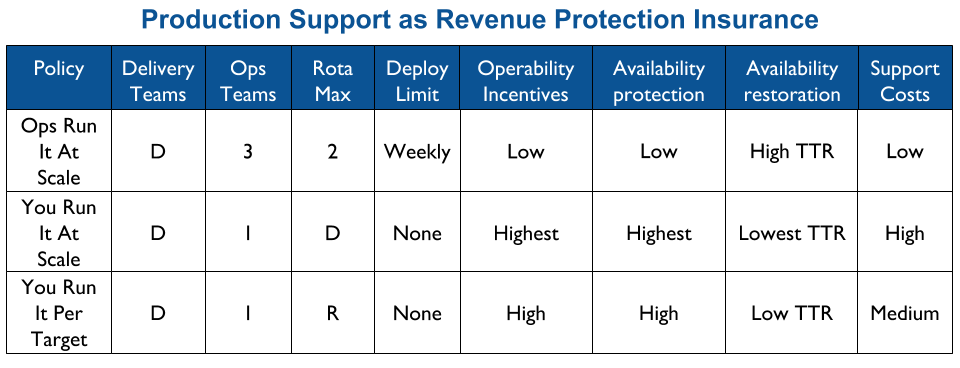
Applying You Build It You Run It at scale maximises the potential for fast deployment lead times, and fast incident resolution times across an IT department. It incentivises Delivery teams to increase operability via failure design, product telemetry, and cumulative learning. It is a revenue insurance policy, that offers high risk coverage at a high premium. This is in contrast to You Build It Ops Run It at scale, which offers much lower risk coverage at a lower premium.

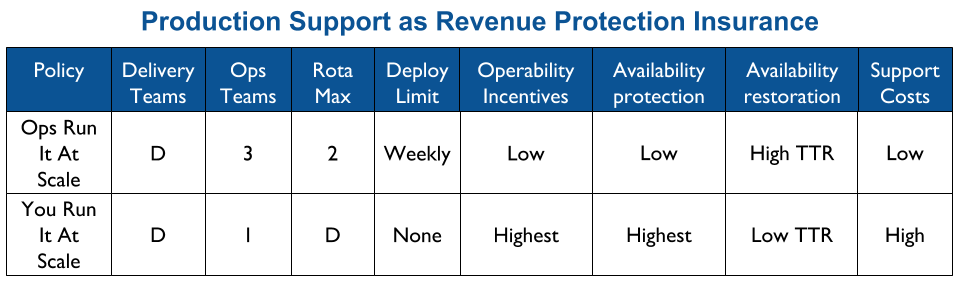
You Build It You Run It at scale can be intimidating. It has a higher engineering cost than You Build It Ops Run It at scale, as the table stakes are higher. These include a centralised catalogue of service ownership, detailed runbooks, on-call training, and global operability measures. It can also have support costs that are significantly higher than You Build It Ops Run It at scale.

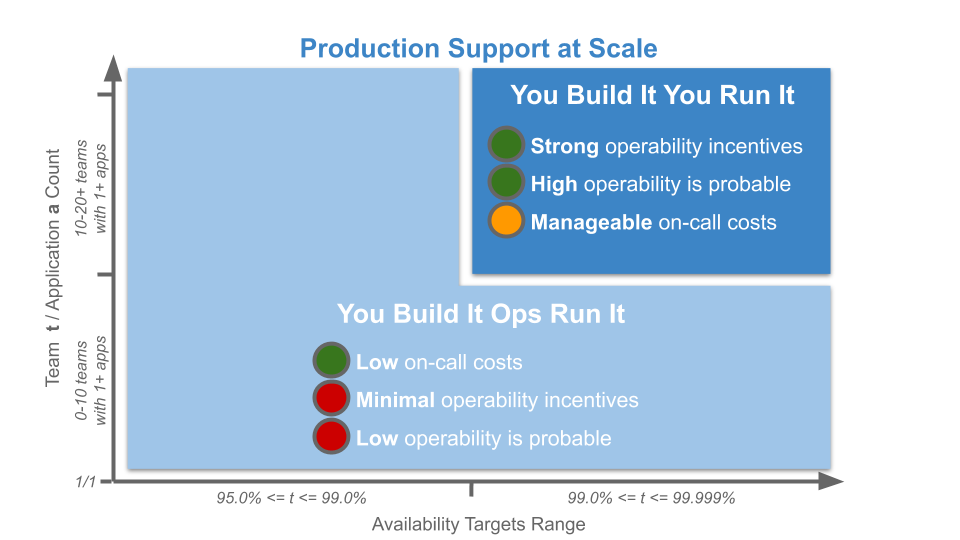
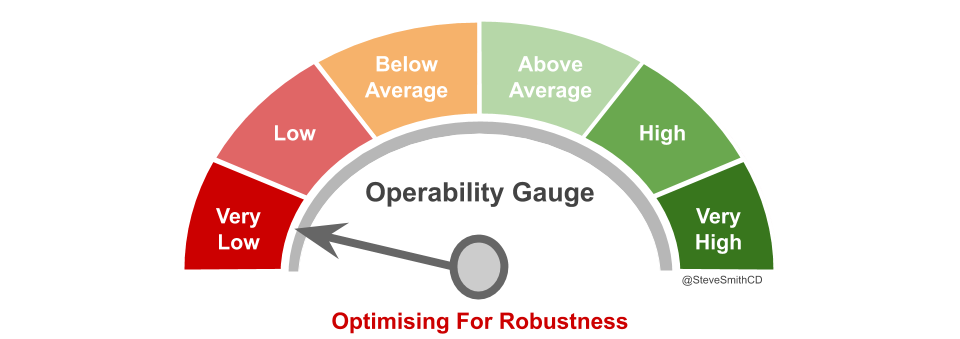
At its extreme, You Build It You Run It at scale will have D support rotas for D Delivery teams. The out of hours support costs for D rotas will be greater than 2 rotas in You Build It Ops Run It at scale, unless Operations support is on an exorbitant third party contract. As a result You Build It Ops Run It at scale can be an attractive insurance policy, despite its severe disadvantages on risk coverage. This should not be surprising, as graceful extensibility trades off with robust optimality. As Mary Patterson et al stated in Resilience and Precarious Success, “fundamental goals (such as safety) tend to be sacrificed with increasing pressure to achieve acute goals (faster, better, and cheaper)”. 

You Build It You Run It at scale does not have to mean 1 Delivery team on-call for every 1 application. It offers cost effectiveness as well as high risk coverage when support costs are balanced with operability incentives and risk of revenue loss. The challenge is to minimise standby costs without weakening operability incentives.

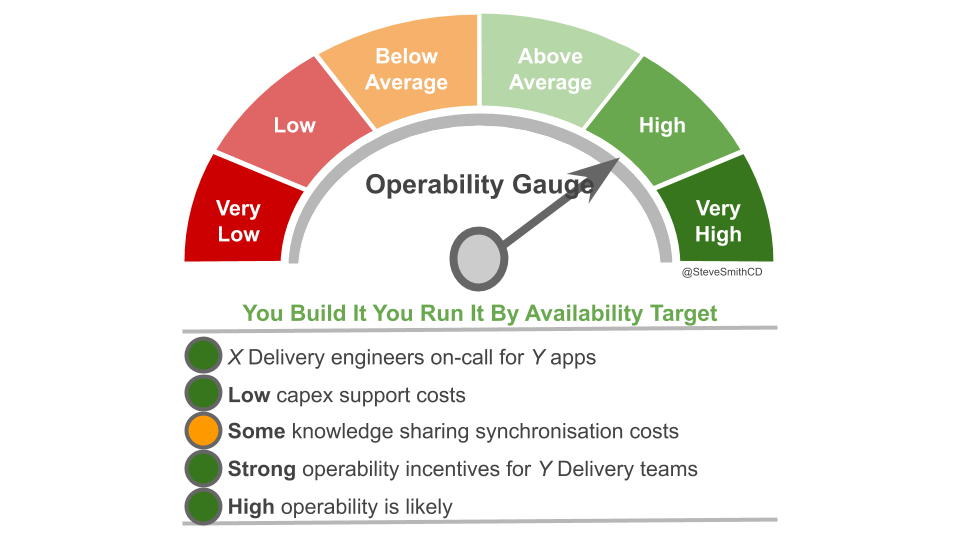
By availability target

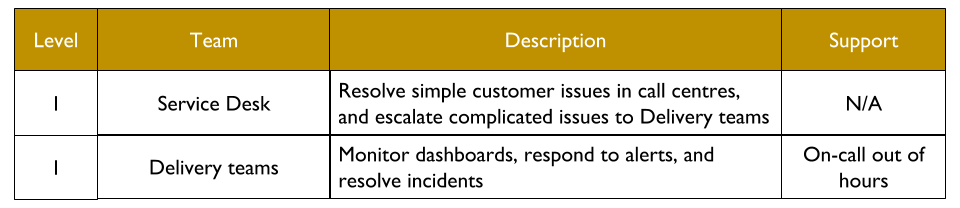
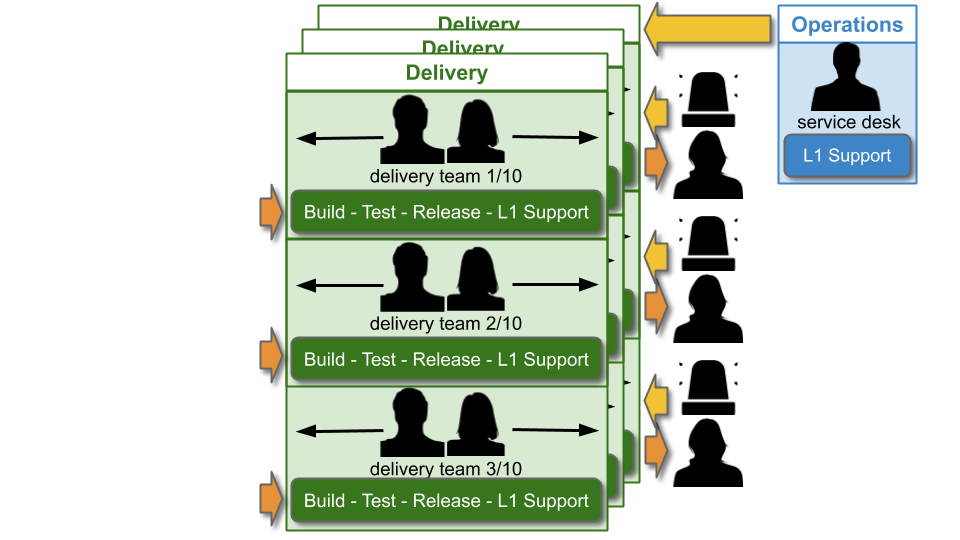
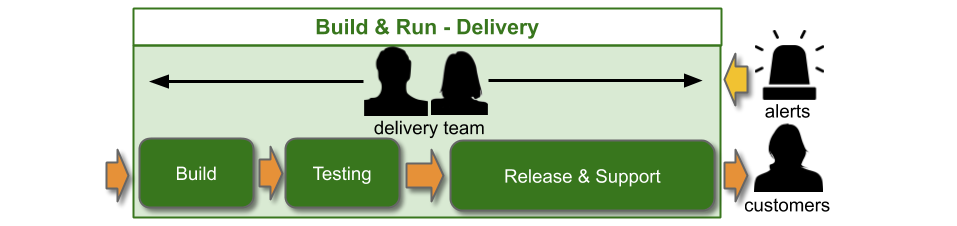
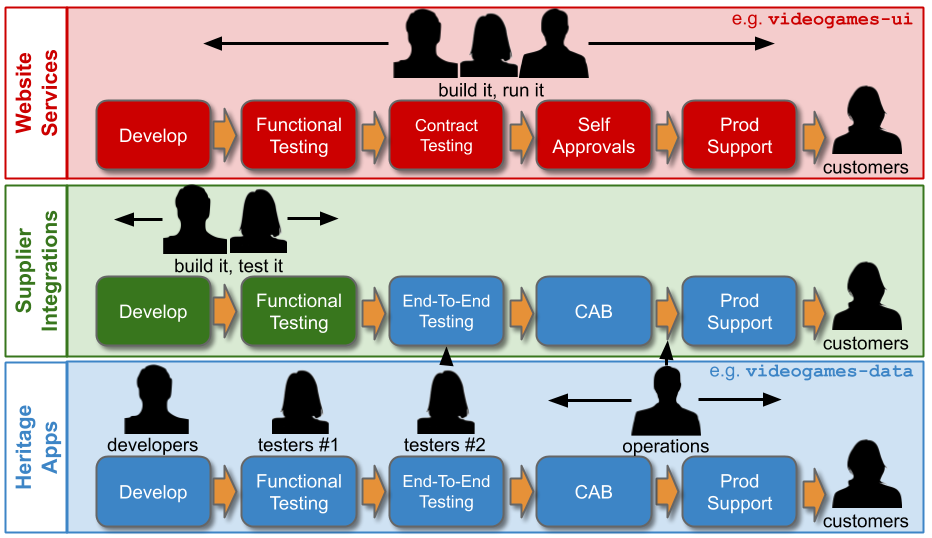
The level of production support afforded to an application in You Build It You Run It at scale should be based on its availability target. In office hours, Delivery teams support their own applications, and halt any feature development to respond to an application alert. Out of hours, production support for an application is dictated by its availability target and rate of product demand.

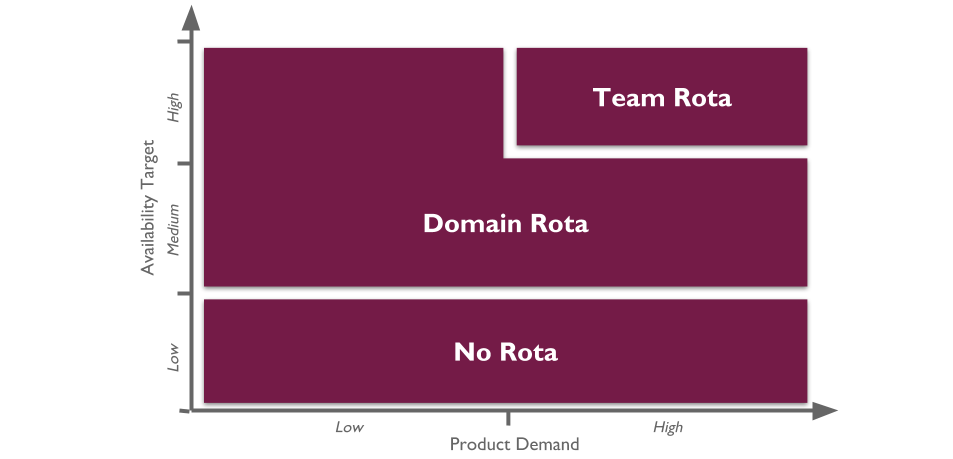
Applications with a low availability target have no out of hours support. This is low cost, easy to implement, and counter-intuitively does not sacrifice operability incentives. A Delivery team responsible for dealing with overnight incidents on the next working day will be incentivised to design an application that can gracefully degrade over a number of hours.  No on-call is also fairer than best endeavours, as there is no expectation for  Delivery team members to disrupt their personal lives without compensation.

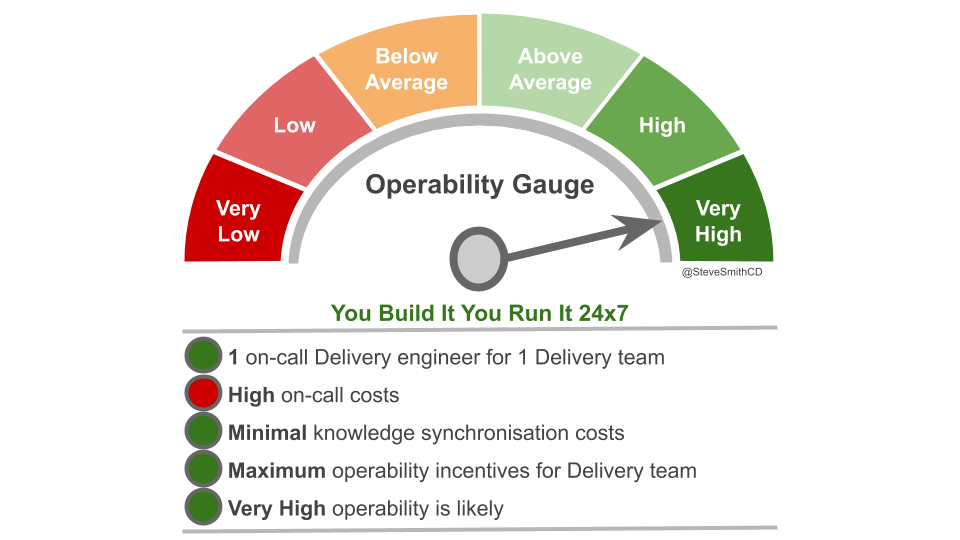
Applications with a high availability target and a high rate of product demand each have their own team rota. A team rota is a single Delivery team member on-call for one or more applications from their team. This is classic You Build It You Run It, and produces the maximum operability incentives as the Delivery team have sole responsibility for their application. When product demand for an application is filled, it should be downgraded to a domain rota.

Applications with a medium availability target share a domain rota. A domain rota is a single Delivery team member on-call for a logical grouping of applications with an established affinity, from multiple Delivery teams.

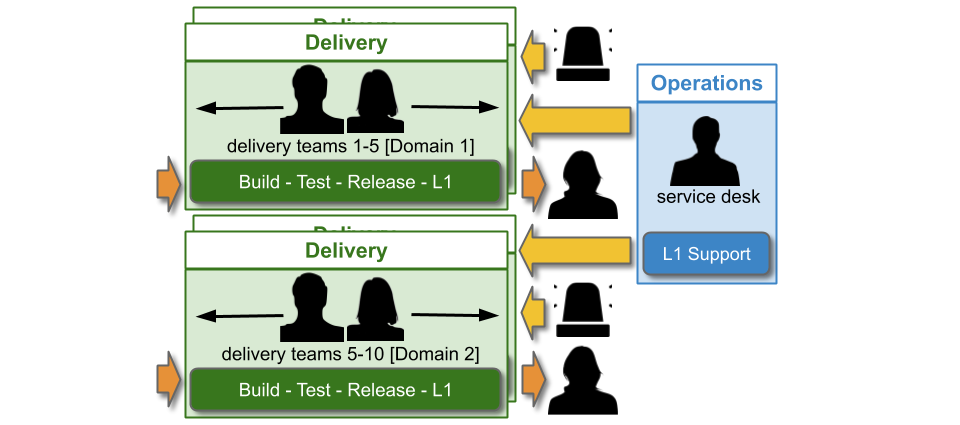
The domain construct should be as fine-grained and flexible as possible. It needs to minimise on-call cognitive load, simplify knowledge sharing between teams, and focus on organisational outcomes. The following constructs should be considered:

  • Product domains – sibling teams should already be tied together by customer journeys and/or sales channels
  • Architectural domains – sibling teams should already know how their applications fit into technology capabilities

The following constructs should be rejected:

  • Geographic domains – per-location rotas for teams split between locations would produce a mishmash of applications, cross-cutting product and architectural boundaries and increasing on-call cognitive load
  • Technology domains – per-tech rotas for teams split between frontend and backend technologies would completely lack a focus on organisational outcomes

A domain rota will create strong operability incentives for multiple Delivery teams, as they have a shared on-call responsibility for their applications. It is also cost effective as people on-call do not scale linearly with teams or applications.  However, domain rotas can be challenging if knowledge sharing barriers exist, such as multiple teams in one domain with dissimilar engineering skills and/or technology choices.  It is important to be pragmatic, and technology choices can be used as a tiebreaker on a product or architectural construct where necessary.

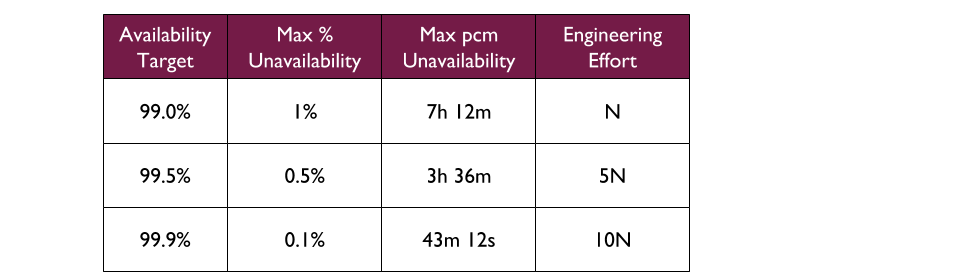
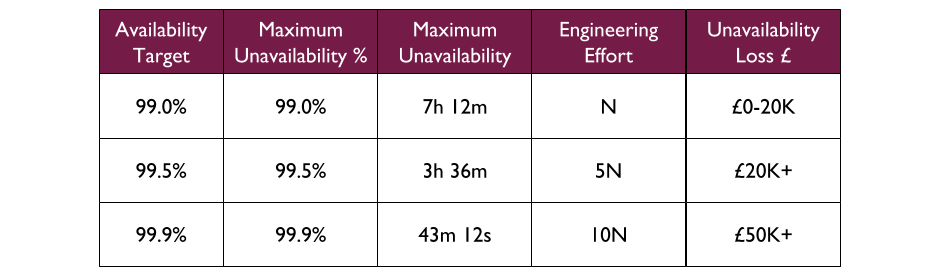
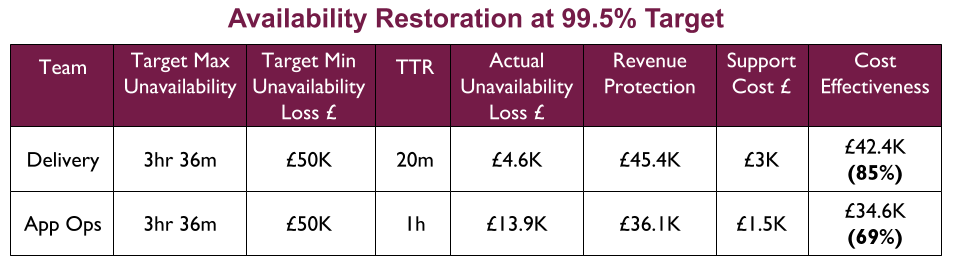
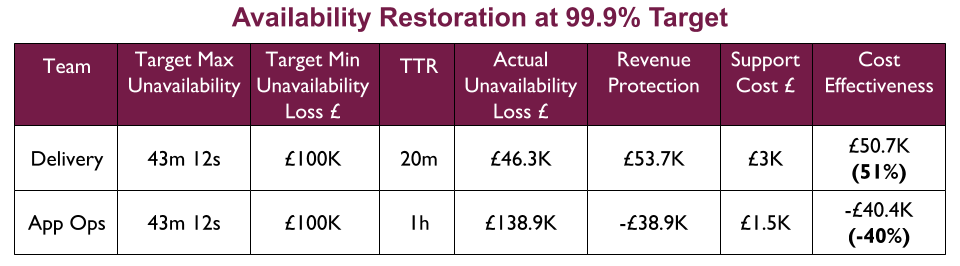
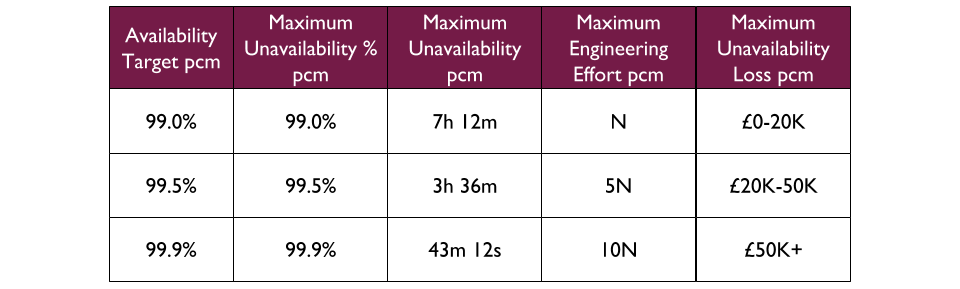
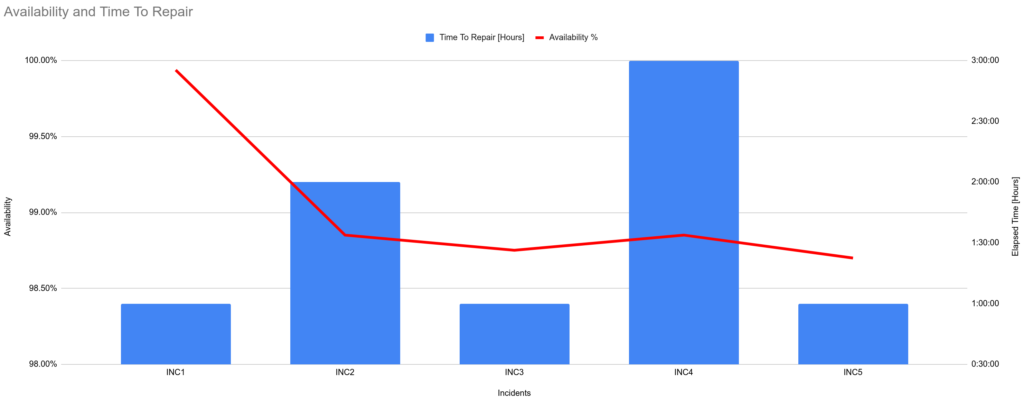
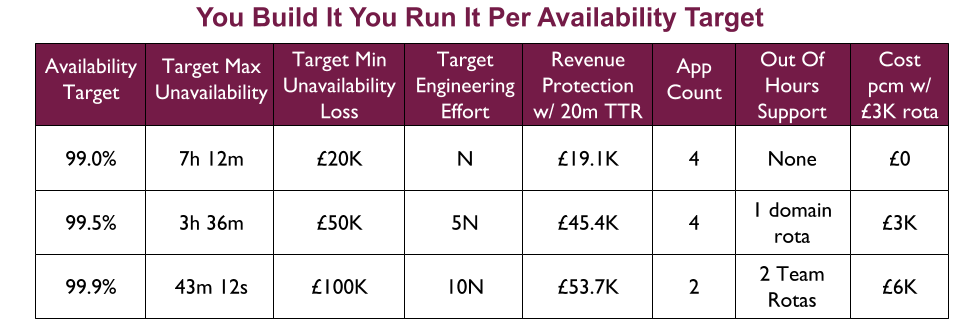
For example, a Fruits R Us organisation has 10 Delivery teams, each with 1 application. There are 3 availability targets of 99.0%, 99.5%, and 99.9%. An on-call rota is £3Kpcm in standby costs. If all 10 applications had their own rota, the support cost of £30Kpcm would likely be unacceptable.

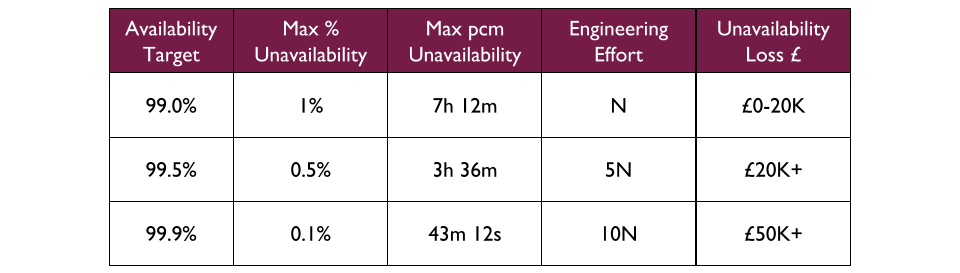
Assume Fruits R Us managers assign minimum revenue losses of £20K, £50K, and £100K to their availability targets, and ask product owners to consider their minimum potential revenue losses per target. The Product and Checkout applications could lose £100K+ in 43 minutes, so they remain at 99.9% and have their own rotas. 4 applications in the same Fulfilment domain could lose £50K+ in 3 hours, so they are downgraded to 99.5% and share a Fulfilment domain rota across 4 teams. 4 applications in the Stock domain could lose £20K in 7 hours but no more, so they are downgraded to 99.0% with no out of hours on-call. This would result in a support cost of £9Kpcm while retaining strong operability incentives.

Optimising costs

A number of techniques can be used to optimise support costs for You Build It You Run It Per Availability Target:

  • Recalibrate application availability targets. Application revenue analytics should regularly be analysed, and compared with the engineering time and on-call costs linked to an availability target. Where possible, availability targets should be downgraded. It should also be possible to upgrade a target, including fixed time windows for peak trading periods
  • Minimise failure blast radius. Rigorous testing and deployment practices including Canary Deployments, Dark Launching, and Circuit Breakers should reduce the cost of application failure, and allow for availability targets to be gradually downgraded. These practices should be validated with automated and exploratory Chaos  Engineering on a regular basis
  • Align out of hours support with core trading hours. A majority of website revenue might occur in one timezone, and within core trading hours. In that scenario, production support hours could be redefined from 0000-2359 to 0600-2200 or similar. This could remove the need for out of hours support 2200-0600, and alerts would be investigated by Delivery teams on the following morning
  • Automated, time-limited shuttering on failure. A majority of product owners might be satisfied with shuttering on failure out of hours, as opposed to application restoration. If so, an automated shutter with per-application user messaging could be activated on application failure, for a configurable time period out of hours. This could remove the need for out of hours support entirely, but would require a significant engineering investment upfront and operability incentives would need to be carefully considered

This list is not exhaustive. As with any other Continuous Delivery or operability practice, You Build It You Run It at scale should be founded upon the Improvement Kata. Ongoing experimentation is the key to success.

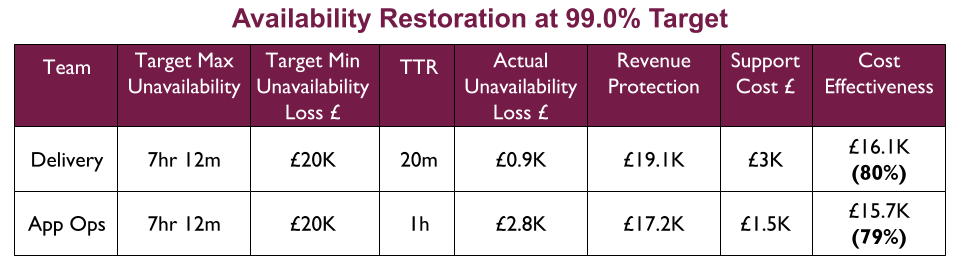
Production support is a revenue insurance policy, and implementing You Build It You Run It at scale is a constant balance between support costs with operability. You Build It You Run It Per Availability Target ensures on-call Delivery team members do not scale linearly with teams and/or applications, while trading away some operability incentives and some Time To Restore – but far less than You Build It Ops Run It at scale. Overall, You Build It You Run It Per Availability Target is an excellent starting point.

The Who Runs It series:

  1. You Build It Ops Run It
  2. You Build It You Run It
  3. You Build It Ops Run It at scale
  4. You Build It You Run It at scale
  5. You Build It Ops Sometimes Run It
  6. Implementing You Build It You Run It at scale
  7. You Build It SRE Run It

Acknowledgements

Thanks to Thierry de Pauw.

You Build It You Run It at scale

How can You Build It You Run It be applied to 10+ teams and applications without an overwhelming support cost? How can operability incentives be preserved for so many teams?

This is part of the Who Runs It series.

Introduction

You Build It You Run It at scale means 10+ Delivery teams are responsible for their own deployments and production support. It is the You Build It You Run It approach, applied to multiple teams and multiple applications.

There is an L1 Service Desk team to handle customer requests. Each Delivery team is on L1 support for their applications, and creates their own monitoring dashboard and alerts. There should be a consistent toolchain for anomaly detection and alert notifications for all Delivery teams, that can incorporate those dashboards and alerts. 

The Service Desk team will tackle customer complaints and resolve simple technology issues. When an alert fires, a Delivery team will practice Stop The Line by halting feature development, and swarming on the problem within the team. That cross-functional collaboration means a problem can be quickly isolated and diagnosed, and the whole team creates new knowledge they can incorporate into future work. If the Service Desk cannot resolve an issue, they should be able to route it to the appropriate Delivery team via an application mapping in the incident management system. 

In On-Call At Any Size, Susan Fowler et al warn “multiple rotations is a key scaling challenge, requiring active attention to ensure practices remain healthy and consistent”. Funding is the first You Build It You Run It practice that needs attention at scale. On-call support for each Delivery team should be charged to the CapEx budget for that team. This will encourage each product manager to regularly work on the delicate trade-off between protecting their desired availability target out of hours and on-call costs. Central OpEx funding must be avoided, as it eliminates the need for product managers to consider on-call costs at all.

Continuous Delivery and Operability at scale

You Build It You Run It has the following advantages at scale:

  • Fast incident resolution – an alert will be immediately assigned to the team that owns the application, and can rapidly swarm to recover from failure and minimise TTR
  • Short deployment lead times – deployments can be performed on demand by a Delivery team, with no handoffs involved
  • Minimal knowledge synchronisation costs – teams can easily convert new operational information into knowledge
  • Focus on outcomes – teams are encouraged to work in smaller batches, towards customer outcomes and product hypotheses
  • Adaptive architecture – applications can be designed with failure scenarios in mind, including circuit breakers and feature toggles to reduce failure blast radius
  • Product telemetry – application dashboards and alerts can be constantly updated to include the latest product metrics
  • Situational awareness – teams will have a prior understanding of normal versus abnormal live traffic conditions that can be relied on during incident response
  • Fair on-call compensation – team members will be remunerated for the disruption to their lives incurred by supporting applications

In Accelerate, Dr Nicole Forsgren et al found “high performance is possible with all kinds of systems, provided that systems – and the teams that build and maintain them – are loosely coupled”. Accelerate research showed the key to high performance is for a team to be able to independently test and deploy its applications, with negligible coordination with other teams. You Build It You Run It enables a team to increase its throughput and achieve Continuous Delivery, by removing rework and queue times associated with deployments and production support. At scale, You Build It You Run It enables an organisation to increase overall throughput while simultaneously increasing the number of teams. This allows an organisation to move faster as it adds more people, which is a true competitive advantage.

You Build It You Run It creates a healthy engineering culture at scale, in which product development consists of a balance between product ideas and operational features. 10+ Delivery teams with on-call responsibilities will be incentivised to care about operability and consistently meeting availability targets, while increasing delivery throughput to meet product demand. Delivery teams doing 24×7 on-call at scale will be encouraged to build operability into all their applications, from inception to retirement.

You Build It You Run It can incur high support costs at scale. It can be cost effective if a compromise is struck between deployment targets, operability incentives, and on-call costs that does not weaken operability incentives for Delivery teams.

Production support as revenue insurance

Production support should be thought of as a revenue insurance policy. As insurance policies, You Build It Ops Run It and You Build It You Run It are opposites at scale in terms of risk coverage and costs.

You Build It Ops Run It offers a low degree of risk coverage, limits deployment throughput, and has a potential for revenue loss on unavailability that should not be underestimated. You Build It You Run It has a higher degree of risk coverage, with no limits on deployment throughput and a short TTR to minimise revenue losses on failure.

You Build It You Run It becomes more cost effective as product demand and reliability needs increase, as deployment targets and availability targets are ratcheted up, and the need for Continuous Delivery and operability becomes ever more apparent. The right revenue insurance policy should be chosen based on the number of teams and applications, and the range of availability targets. The fuzzy model below can be used to distinguish when You Build It You Run It is appropriate – when availability targets are demanding and the number of teams and applications is 10+.

The Who Runs It series

  1. You Build It Ops Run It
  2. You Build It You Run It
  3. You Build It Ops Run It at scale
  4. You Build It You Run It at scale
  5. You Build It Ops Sometimes Run It
  6. Implementing You Build It You Run It at scale
  7. You Build It SRE Run It

Acknowledgements

Thanks to Thierry de Pauw.

Availability targets

Why is it important to measure operability? What should be the trailing indicators and leading indicators of operability?

TL;DR:

  • Reliability means balancing the risk of unavailability with the cost of sustaining availability.
  • Availability can be understood as a level of availability, from 99.0% to 99.999%.
  • Increasing an availability level incurs up to an order of magnitude more engineering effort.
  • An availability target is selected by a product manager based upon the maximum revenue loss they can tolerate for their service.

Introduction

Organisations must have reliable IT applications at the heart of their business if they are to innovate in changing markets. Reliability is defined by Patrick O’Connor and Andre Kleyner in Practical Reliability Engineering as “the probability that [a system] will perform a required function without failure under stated conditions for a stated period of time”. There must be an investment in reliability if propositions are to be rapidly delivered to customers and remain highly available.

Reliability means balancing the risk of application unavailability with the cost of sustaining application availability. Application unavailability will incur opportunity costs related to lower customer revenue, loss of confidence, and reputational damage. On the other hand, sustaining application availability also incurs opportunity costs, as engineering time must be devoted to operational work instead of new product features visible to customers. In Site Reliability Engineering, Betsey Beyer et al state “cost does not increase linearly… an incremental improvement in reliability may cost 100x more than the previous increment”.

Furthermore, the user experience of application availability will be constrained by lower levels of user device availability. For example, a smartphone with 99.0% availability will not allow a user to experience a website with 99.999% availability. 100% availability is never the answer, as the cost is too high and users will not perceive any benefits. Maximising feature delivery will harm availability, maximising availability will harm feature delivery.

Availability targets

Application availability can be understood as an availability target. An availability target represents a desired level of availability, and is usually expressed as a number of nines. Each additional nine of availability represents an order of magnitude more of engineering effort. For example, 99.0% availability means “two nines”, and if its engineering effort is N then 99.9% availability would require 10N in engineering effort.

An availability target should be coupled to product risk. This will ensure a product owner translates their business goals into operational objectives, and empowers their team to strike a balance between application availability and costs. The goal is to improve the operability of an application until its availability target is met, and can be sustained.

For example, consider a Fruits R Us organisation with 3 availability targets for its applications – 99.0% (“two nines”), 99.5% (“two and a half nines”), and 99.9% (“three nines”). The 99.9% availability target allows for a maximum of 0.1% unavailability per month, which in a 30 day month equates to a maximum of 43 mins 12 seconds unavailability. It also requires 10 times more engineering effort to sustain than the 99.0% availability target.

In Site Reliability Engineering, the maximum unavailability per month for an availability target is expressed as an error budget. Error budgets are are a method of formalising the shared ownership and prioritisation of product features versus operational features, and might be used to halt production deployments during periods of sustained unavailability.

Availability target selection

A product owner should select an availability target by comparing their projected revenue impact of application unavailability with the set of possible availability targets. They need to consider if their application is tied directly or indirectly to revenue, their application payment model, what expectations users will have, and what level of service is provided by competitors in the same marketplace.

First, an organisation needs to establish a minimum Cost Of Delay revenue loss for each availability target, on loss of availability. Then a product owner should estimate the Cost Of Delay for their application being unavailable for the duration of each target. The Value Framework by Joshua Arnold et al can be used to estimate the financial impact of the loss of an application:

  • Increase Revenue – does the application increase sales levels
  • Protect Revenue – does the application sustain current sales levels
  • Reduce Costs – does the application reduce current incurred costs
  • Avoid Costs – does the application reduce potential for future incurred costs

This will allow a product owner to balance their need for application availability with the opportunity costs associated with consistently meeting that availability level.

For example, at Fruits R Us a set of revenue bands is attached to existing availability targets, based on an analysis of existing revenue streams. The 99.0% availability target is intended for applications where the Cost Of Delay on unavailability is at least £50K in 7h 12m, whereas 99.9% is for unavailability that could cost £1M or more in only 43m 12s.

A proposed Bananas application is expected to produce a monthly revenue increase of £40K. It is intended to replace an Apples application, which has an availability target of 99.0% sustained by an average of 8 engineering hours per month. The Bananas product owner believes customers will have heightened reliability expectations due to superior competitor offerings in the marketplace, and that Bananas could lose the £40K revenue increase within 2 hours of unavailability in a month. The 99.0% availability target can fit 2 hours of unavailability into its 7h 12m ceiling, but cannot fit a £40K revenue loss. The 99.5% availability target is selected, and the Bananas product owner knows at 5N engineering effort that 40 engineering hours will be needed per month to invest in operational  features.

Acknowledgements

Thanks to Thierry de Pauw for the review

You Build It You Run It

What is You Build It You Run It, and why does it have such a positive impact on operability? Why is it important to balance support cost effectiveness with operability incentives?

This is part of the Who Runs It series.

Introduction

The usual alternative to You Build It Ops Run It is for a Delivery team to assume responsibility for its Run activities, including deployments and production support. This is often referred to as You Build It You Run It.

You Build It You Run It consists of single-level swarming support, with developers on-call. There is also a Service Desk to handle customer requests. The  toolchain needs to include anomaly detection, alert notifications, messaging, and incident management tools, such as Prometheus, PagerDuty, Slack, and ServiceNow.

As with You Build It Ops Run It, Service Desk is an L1 team that receives customer requests and will resolve simple technology issues wherever possible. A development team in Delivery is also L1, and they will monitor dashboards, receive alerts, and respond to incidents. Service Desk should escalate tickets for particular website pages or user journeys into the incident management system, which would be linked to applications.

Delivery engineering costs and on-call support will both be paid out of CapEx, and Operations teams such as Service Desk will be under OpEx. As with You Build It Ops Run It, the Service Desk team might be outsourced to reduce OpEx costs. CapEx funding for You Build It You Run It will compel a product manager to balance their desired availability with on-call costs. OpEx funding for Delivery on-call should be avoided wherever possible, as it encourages product managers to artificially minimise risk tolerance and select high availability targets irregardless of on-call costs.

Continuous Delivery and operability

Swarming support means Delivery prioritising incident resolution over feature development, in line with the Continuous Delivery practice of Stop The Line and the Toyota Andon Cord. This encourages developers to limit failure blast radius wherever possible, and prevents them from deploying changes mid-incident that might exacerbate a failure. Swarming also increases learning, as it ensures developers are able to uncover perishable mid-incident information, and cross-pollinate their skills.

You Build It You Run It also has the following advantages for product development:

  • Short deployment lead times – lead times will be minimised due to no  handoffs
  • Minimal knowledge synchronisation costs – developers will be able to easily share application and incident knowledge, to better prepare themselves for future incidents
  • Focus on outcomes – teams will be empowered to deliver outcomes that test product hypotheses, and iterate based on user feedback
  • Short incident resolution times – incident response will be quickened by no support ticket handoffs or rework
  • Adaptive architecture – applications will be architected to limit failure blast radius, including bulkheads and circuit breakers
  • Product telemetry – dashboards and alerts will be continually updated by developers, to be multi-level and tailored to the product context
  • Traffic knowledge – an appreciation of the pitfalls and responsibilities inherent in managing live traffic will be factored into design work
  • Rich situational awareness – developers will respond to incidents with the same context, ways of working, and tooling
  • Clear on-call expectations – developers will be aware they are building applications they themselves will support, and they should be remunerated

You Build It You Run It creates the right incentives for operability. When Delivery is responsible for their own deployments and production support, product owners will be more aware of operational shortfalls, and pressed by developers to prioritise operational features alongside product ideas. Ensuring that application availability is the responsibility of everyone will improve outcomes and accelerate learning, particularly for developers who in IT As A Cost Centre are far removed from actual customers. Empowering delivery teams to do on-call 24×7 is the only way to maximise incentives to build operability in.

Production support as revenue insurance

The most common criticism of You Build It You Run It is that it is too expensive. Paying Delivery team members for L1 on-call standby and callout can seem costly, particularly when You Build It Ops Run It allows for L1-2 production support to be outsourced to cheaper third party suppliers. This perception should not be surprising, given David Wood’s assertion in The Flip Side Of Resilience that “graceful extensibility trades off with robust optimality”. Implementing You Build It You Run to increase adaptive capacity for future incidents may look wasteful, particularly if incidents are rare.

A more holistic perspective would be to treat production support as revenue insurance for availability targets, and consider risk in terms of revenue impact instead of incident count. A production support policy will cover:

  • Availability protection
  • Availability restoration on loss

You Build It You Run It maximises incentives for Delivery teams to focus from the outset on protecting availability, and it guarantees the callout of an L1 Delivery engineer to restore availability on loss. This should be demonstrable with a short Time To Restore (TTR), which could be measured via availability time series metrics or incident duration. That high level of risk coverage will come at a higher premium. This means You Build It You Run It will be more cost effective for applications with higher availability targets and greater potential for revenue loss.

You Build It Ops Run It offers a lower level of risk coverage at a lower premium, with weak incentives to protect application availability and an L2 Application Operations team to restore application availability. This will produce a higher TTR  than You Build It You Run It. This may be acceptable for applications with lower availability targets and/or limited potential for revenue loss.

The cost effectiveness of a production support policy can be calculated per availability target by comparing its availability restoration capability with support cost. For example, at Fruits R Us there are 3 availability targets with estimated maximum revenue losses on availability target loss. Fruits R Us has a Delivery team with an on-call cost of £3K per calendar month and a TTR of 20 minutes, and an Application Operations team with a cost of £1.5K per month and a TTR of 1 hour.

Projected availability loss per team is a function of TTR and the £ maximum availability loss per availability target, and lower losses can be calculated for the Delivery team due to its shorter TTR.

At 99.0%, Application Operations is as cost effective at availability restoration of a 7 hour 12 minute outage as the Delivery team, and Fruits R Us might consider the merits of You Build It Ops Run It. However, this would mean Application Operations would be unable to build operability in and increase availability protection, and the Delivery team would have few incentives to contribute.

At 99.5%, the Delivery team is more cost effective at availability restoration of a 3 hour 36 minute outage than Application Operations.

At 99.9%, the Delivery team is far more cost effective at availability restoration of a 43 minute 12 second outage. The 1 hour TTR of Application Operations means their £ projected availability loss is greater than the £ maximum availability loss at 99.9%. You Build It You Run It is the only choice.

The Who Runs It series:

  1. You Build It Ops Run It
  2. You Build It You Run It
  3. You Build It Ops Run It at scale
  4. You Build It You Run It at scale
  5. You Build It Ops Sometimes Run It
  6. Implementing You Build It You Run It at scale
  7. You Build It SRE Run It

Acknowledgements

Thanks to Thierry de Pauw.

Operability measures

Why is it important to measure operability? What should the trailing indicators and leading indicators of operability?

TL;DR:

  • The trailing indicators of operability are availability rate and time to restore availability.
  • The leading indicators of operability include the frequency of Chaos Days and the time to act upon incident review findings.

Introduction

In How To Measure Anything, Douglas Hubbard states organisations have a Measurement Inversion, and waste their time measuring variables with a low information value. This is certainly true of IT reliability, which is usually badly measured if at all. By proxy, this includes operability as well.

In many organisations, reliability is measured by equating failures with recorded production incidents. Incident durations are calculated for Mean Time Between Failures (MTBF) and Mean Time To Repair (MTTR), or there is just an overall incident count. These are classic vanity measures. They are easy to implement and understand, but they have a low information value due to the following:

  • Quantitative measures such as incident count have no reflection on business drivers, such as percentage of unrecoverable user errors
  • Manual recording of incidents in a ticket system can be affected by data inaccuracies and cognitive biases, such as confirmation bias and recency bias
  • Goodhart’s Law means measuring incidents will result in fewer incident reports. People adjust their behaviours based on how they are measured, and measuring incidents will encourage people to suppress incident reports with potentially valuable information.

If operability is to be built into applications, there is a need to identify trailing and leading indicators of operability that are holistic and actionable. Measures of operability that encourage system-level collaboration rather than individual productivity will pinpoint where improvements need to be made. Without those indicators, it is difficult to establish a clear picture of operability, and where changes are needed.

Effective leading and trailing indicators of software delivery should be visualised and publicly communicated throughout an organisation, via internal websites and dashboards. Information radiators help engineers, managers, and executives understand at a glance the progress being made and alignment with organisational goals. Transparency also reduces the potential for accidents and bad behaviours. As Louis Brandeis said in Other People’s Money “sunlight is said to be the best of disinfectants; electric light the most efficient policeman”.

Availability as a trailing indicator

Failures should be measured in terms of application availability targets, not production incidents. Availability measurements are easy to implement with automated time series metrics collection, easy to understand, and have a high information value. Measurements can be designed to distinguish between full and partial degradation, and between unrecoverable and recoverable user errors.

For example, a Fruits R Us organisation has 99.0%, 99.5%, and 99.9% as its availability targets A product manager for an Oranges application selects 99.5% for at least the first 3 months.

Availability should be measured in the aggregate as Request Success Rate, as described by Betsey Beyer et al in Site Reliability Engineering. Request Success Rate can approximate degradation for customer-facing or back office applications, provided a well-defined notion of successful and unsuccessful work. It covers partial and full downtime for an application, and is more fine-grained than uptime versus downtime.

When an application has a Request Success Rate lower than its availability target, it is considered a failure. The average time to restore availability can be tracked as a Mean Time To Repair metric, and visualised in a graph alongside availability.

At Fruits R Us, the Oranges application communicates with upstream consumers via a HTTPS API. Its availability is constantly measured by Request Success Rate, which is implemented by checking the percentage of upstream requests that produce a HTTP response code lower than HTTP 500. When the Request Success Rate over 15 minutes is lower than the availability target of 99.5%, it is considered a failure and a production incident is raised. An availability graph can be used to illustrate availability, incidents, and time to repair as a trailing indicator of operability.

Leading indicators of operability

Failures cannot be predicted in a production environment as it is a complex, adaptive system. In addition, it is easy to infer a false narrative of past behaviours from quantitative data. The insights uncovered from an availability trailing indicator and the right leading indicators can identify inoperability prior to a production incident, and they can be pattern matched to select the best heuristic for the circumstances.

A leading indicator should be split into an automated check and one or more exploratory tests. This allows for continuous discovery of shallow data, and frees up people to examine contextual, richer data with a higher information value. Those exploratory tests might be part of an operational readiness assessment, or a Chaos Day dedicated to particular applications. Leading indicators of operability can include:

Learning is a vital leading indicator of operability. An organisation is more likely to produce operable, reliable applications if it fosters a culture of continuous learning and experimentation. After a production incident, nothing should be more important than everyone in the organisation having the opportunity to accumulate new knowledge, for their colleagues as well as themselves.

The initial automated check of learning should be whether a post-incident review is published within 24 hours of an incident. This is easy to automate with a timestamp comparison between a post-incident review document and the central incident system, easy to communicate across an organisation, and highly actionable. It will uncover incident reviews that do not happen, are not publicly published, or happen too late to prevent information decay.

Another learning check should be the throughput of operability tasks, comprising the lead time to complete a task and interval between completing tasks. Tasks should be created and stored in a machine readable format during operability readiness assessments, Chaos Days, exploratory testing, and other automated checks of operability. Task lead time should not be more than a week, and task interval should not exceed the fastest learning source. For example, if operability readiness assessments occur every 90 days and Chaos Days are 30 days then at least one operability task should be completed per month.

Acknowledgements

Thanks as usual to Thierry de Pauw for reviewing this series

Build Operability in

What is operability, how does it promote resilience, and how does building operability into your applications drive Continuous Delivery adoption?

TL;DR:

  • Operability refers to the ability to safely and reliably operate a production application.
  • Increasing service resilience depends on adding sources of adaptive capacity that increase operability.
  • Continuous Delivery depends on increasing service resilience.

Introduction

The origins of the 20th century, pre-Internet IT As A Cost Centre organisational model can be traced to the suzerainty of cost accounting, and the COBIT management and governance framework. COBIT has recommended sequential Plan-Build-Run phases to maximise resource efficiency since its launch in 1996. The Plan phase is business analysis and product development, Build is product engineering, and Run is product support. The justification for this is the high compute costs and high transaction costs for a release in the 1990s.

With IT As A Cost Centre, Plan happens in a Product department, and Build and Run happens in an IT department. IT will have separate Delivery and Operations groups, with competing goals:

  • Delivery will be responsible for building features
  • Operations will be responsible for running applications

Delivery and Operations will consist of functionally-oriented teams of specialists. Delivery will have multiple development teams. Operations will have Database, Network, and Server teams to administer resources, a Service Transition team to check operational readiness prior to launch, and one or more Production Support teams to respond to live incidents.

Siloisation causes Discontinuous Delivery

In High Velocity Edge, Dr. Steven Spear warns over-specialisation leads to siloisation, and causes functional areas to “operate more like sovereign states”. Delivery and Operations teams with orthogonal priorities will create multiple handoffs in a technology value stream. A handoff means waiting in a queue for a downstream team to complete a task, and that task could inadvertently produce more upstream work.

Furthermore, the fundamentally opposed incentives, nomenclature, and risk appetites within Delivery and Operations teams will cause a pathological culture to emerge over time. This is defined by Ron Westrum in A Typology of Organisational Cultures as a culture of power-oriented interactions, with low cooperation and neglected responsibilities.

Plan-Build-Run was not designed for fast customer feedback and iterative product development. The goal of Continuous Delivery is to achieve a deployment throughput that satisfies product demand. Disparate Delivery and Operations teams will inject delays and rework into a technology value stream such that lead times are disproportionately inflated. If product demand dictates a throughput target of weekly deployments or more, Discontinuous Delivery is inevitable.

Robustness breeds inoperability

Most IT cost centres try to achieve reliability by Optimising For Robustness, which means prioritising a higher Mean Time Between Failures (MTBF) over a lower Mean Time To Repair (MTTR). This is based on the idea a production environment is a complicated system, in which homogeneous application processes have predictable, repeatable interactions, and failures are preventable.

Reliability is dependent on operability, which can be defined as the ease of safely operating a production system. Optimising For Robustness produces an underinvestment in operability, due to the following:

  • A Diffusion Of Responsibility between Delivery and Operations. When Operations teams are accountable for operational readiness and incident response, Delivery teams have little reason to work on operability
  • A Normalisation of Deviation within Delivery and Operations. When failures are tolerated as rare and avoidable, Delivery and Operations teams will pursue cost savings rather than an ability to degrade on failure

That underinvestment in operability will result in Delivery and Operations teams creating brittle, inoperable production systems.

Symptoms of brittleness will include:

  • Inadequate telemetry – an inability to detect abnormal conditions
  • Fragile architecture – an inability to limit blast radius on failure
  • Operator burnout – an inability to perform heroics on demand
  • Blame games – an inability to learn from experience

This is ill-advised, as failures are entirely unavoidable. A production environment is actually a complex system, in which heterogeneous application processes have unpredictable, unrepeatable interactions, and failures are inevitable. As Richard Cook explains in How Complex Systems Fail the complexity of these systems makes it impossible for them to run without multiple flaws“. A production environment is perpetually in a state of near-failure.

A failure occurs when multiple flaws unexpectedly coalesce and impede a business function, and the costs can be steep for a brittle, inoperable application. Inadequate telemetry widens the sunk cost duration from failure start to detection. A fragile architecture expands the opportunity cost duration from detection until resolution, and the overall cost per unit time. Operator burnout increases all costs involved, and blame games allow similar failures to occur in the future.

Resilience needs operability

Optimising For Resilience is a more effective reliability strategy. This means prioritising a lower MTTR over a higher MTBF. The ability to quickly adapt to failures is more important than fewer failures, although some failure classes should never occur and some safety-critical systems should never fail.

Resilience can be thought of as graceful extensibility. In The Theory of Graceful Extensibility, David Woods defines it as “a blend of graceful degradation and software extensibility”. A complex system with high graceful extensibility will continue to function, whereas a brittle system would collapse.

Graceful extensibility is derived from the capacity for adaptation in a system. Adaptive capacity can be created when work is effectively managed to rapidly reveal new problems, problems are quickly solved and produce new knowledge, and new local knowledge is shared throughout an organisation. These can be achieved by improving the operability of a system via:

  • An adaptive architecture
  • Incremental deployments
  • Automated provisioning
  • Ubiquitous telemetry
  • Chaos Engineering
  • You Build It You Run It
  • Post-incident reviews

Investing in operability creates a production environment in which applications can gracefully extend on failure. Ubiquitous telemetry will minimise sunk cost duration, an adaptive architecture will decrease opportunity cost duration, operator health will aid all aspects of failure resolution, and post-incident reviews will produce shareable knowledge for other operators. The result will be what Ron Westrum describes as a generative culture of performance-oriented interactions, high cooperation, and shared risks.

Dr. W. Edwards Deming said in Out Of The Crisis that “you cannot inspect quality into a product”. The same is true of operability. You cannot inspect operability into a product. Building operability in from the outset will remove handoffs, queues, and coordination costs between Delivery and Operations teams in a technology value stream. This will eliminate delays and rework, and allow Continuous Delivery to be achieved.

Acknowledgements

Thanks to Thierry de Pauw for the review

Multi-Demand Operations

How can Multi-Demand Operations eliminate handoffs and adhere to ITIL? Why are Service Transition, Change Management, and Production Support activities inimical to Continuous Delivery? How can such Policy Rules can be turned into ITIL-compliant Policy Guidelines that increase flow?

This is part 5 of the Strategising for Continuous Delivery series

Know Operations activities

When an organisation has IT As A Cost Centre, its IT department will consist of siloed Delivery and Operations groups. This is based on the outdated COBIT notion of sequential Plan-Build-Run activities, with Delivery teams building applications and Operations teams running them. If the Operations group has adopted ITIL Service Management, its Run activities will include:

  • Service Transition – perform operational readiness checks for an application prior to live traffic
  • Change Management – approve releases for an application with live traffic 
  • Tiered Production Support – monitor for and respond to production incidents for applications with live traffic  

Well-intentioned, hard working Operations teams in IT As A Cost Centre will be incentivised to work in separate silos to implement these activities as context-free, centralised Policy Rules.

See rules as constraints

Policy Rules from Operations will inevitably inject delays and rework into a technology value stream, due to the handoffs and coordination costs involved.  One of those Policy Rules will likely constrain throughput for all applications in a high demand group, even if it has existed without complaint in lower demand groups for years.

Service Transition can delay an initial live launch by weeks or months. Handing over an application from Delivery to Operations means operational readiness is only checked at the last minute. This can result in substantial rework on operational features when a launch deadline looms, and little time is available. Furthermore, there is little incentive for Delivery teams to assess and improve operability when Operations will do it for them.

Change Management can delay a release by days or weeks. Requesting an approval means a Change Advisory Board (CAB) of Operations stakeholders must find the time to meet and assess the change, and agree a release date. An approval might require rework in the paperwork, or in the application changeset. Delays and rework are exacerbated during a Change Freeze, when most if not all approvals are suspended for days at a time. In Accelerate, Dr. Nicole Forsgren et al prove a negative correlation between external approvals and throughput, and conclude “it is worse than having no change approval process at all”.

Tiered Production Support can delay failure resolution by hours or days. Raising a ticket incurs a progression from a Level 1 service desk to Level 2 support agents, and onto Level 3 Delivery teams until the failure is resolved. Non-trivial tickets will go through one or more triage queues until the best-placed responder is found. A ticket might involve rework if repeated, unilateral reassignments occur between support levels, teams, and/or individuals. This is why Jon Hall argues in ITSM and why three-tier support should be replaced with Swarming “the current organizational structure of the vast majority of IT support organisations is fundamentally flawed”.

These Policy Rules will act as Risk Management Theatre to varying degrees in different demand groups. They are based on the misguided assumption that preventative controls on everyone will prevent anyone from making a mistake. They impede knowledge sharing, restrict situational awareness, increase opportunity costs, and actively contribute to Discontinuous Delivery.

Example – MediaTech

At MediaTech, an investment in re-architecting videogames-ui and videogames-data has increased videogames-ui deployment frequency to every 10 days. Yet the Website Services demand group has a target of 7 days, and using the Five Focussing Steps reveals Change Management is the constraint for all applications in the Website Services technology value stream.

A Multi-Demand lens shows a Change Management policy inherited from the lower demand Supplier Integrations and Heritage Apps demand groups. All Website Services releases must have an approved Normal Change, as has been the case with Supplier Integrations and Heritage Apps for years. Normal Changes have a lead time of 0-4 days. This is the most time-consuming activity in Operations, due to the handoffs between approver groups. It is the constraint on Website Services like videogames-ui.

Create ITIL guidelines

Siloed Operations activities are predicated on high compute costs, and the high transaction cost of a release. That may be true for lower demand applications in an on-premise estate. However, Cloud Computing and Continuous Delivery have invalidated that argument for high demand applications. Compute and transaction costs can be reduced to near-zero, and opportunity costs are far more significant.

The intent behind Service Transition, Change Management, and Production Support is laudable. It is possible to re-design such Policy Rules into Policy Guidelines, and implement ITIL principles according to the throughput target of a demand group as well as its service management needs. Those Policy Rules can be replaced with Policy Guidelines, so high demand applications have equivalent lightweight activities while lower demand applications retain the same as before.

Converting Operations Policy Rules into Policy Guidelines will be more palatable to Operations stakeholders if a Multi-Demand Architecture is in place, and hard dependencies have previously been re-designed to shrink failure blast radius. A deployment pipeline for high demand applications that offers extensive test automation and stable deployments is also important.

Multi-Demand Service Transition

Service Transition can be replaced by Delivery teams automating a continual assessment of operational readiness, based on ITIL standards and Operations recommendations. Operational readiness checks should include availability, request throughput, request latency, logging dashboards, monitoring dashboards, and alert rules.

There should be a mindset of continual service transition, with small batch sizes and tight production feedback loops used to identify leading signals of inoperability before a live launch. For example, an application might have automated checks for the presence of a Four Golden Signals dashboard, and Service Level Objective alerts based on Request Success Rate.

Multi-Demand Change Management

Change Management can be streamlined by Delivery teams automating change approval creation and auditing. ITIL has Normal and Emergency Changes for irregular changes. It also has Standard Changes for repeatable, low risk changes which can be pre-approved electronically. Standard Changes are entirely compatible with Continuous Delivery.

Regular, low risk changes for a high demand application should move to a Standard Change template. Low risk, repeatable changes would be pre-approved for live traffic as often as necessary. The criteria for Standard Changes should be pre-agreed with Change Management. Entry criteria could be 3 successful Normal Changes, while exit criteria could be 1 failure.

Irregular, variable risk changes for high demand applications should move to team-approved Normal Changes. The approver group for low and medium risk changes would be the Delivery team, and high risk changes would have Delivery team leadership as well. Entry criteria could be 3 successful Normal Changes and 100% on operational readiness checks.

A Change Freeze should be minimised for high demand applications. For 1-2 weeks before a peak business event, there could be a period of heightened awareness that allows Standard Changes and low-risk Normal Changes only. There could be a 24 hour Change Freeze for the peak business event itself, that allows Emergency Changes only.

The deployment pipeline should have traceability built in. A change approval should be linked to a versioned deployment, and the underlying code, configuration, infrastructure, and/or schema changes. This should be accompanied by a comprehensive engineering effort from Delivery teams for ever-smaller changesets, so changes can remain low risk as throughput increases. This should include Expand-Contract, Decouple Release From Launch, and Canary Deployments for zero downtime deployments.

Multi-Demand Production Support

Tiered Production Support can be replaced by Delivery teams adopting You Build It, You Run It. A Level 1 service desk should remain for any applications with direct customer contact. Level 2 and Level 3 support should be performed by Delivery team engineers on-call 24/7/365 for the applications they build. 

Logging dashboards, monitoring dashboards, and alert rules should be maintained by engineers, and alert notifications should be directed to the team. In working hours, a failure should be prioritised over feature development, and be investigated by multiple team members. Outside working hours, a failure should be handled by the on-call engineer. Teams should do their own incident management and post-incident reviews.

You Build It, You Run It maximises incentives for Delivery teams to build operability into their applications from the outset of development. Operational accountability should reside with the product owner. They should have to prioritise operational features against user features, from a single product backlog. There should be an emphasis on reliable live traffic over feature development, cross-functional collaboration within and between teams, and a cross-pollination of skills. 

Example – MediaTech

At MediaTech, a prolonged investment is made in Operations activities for Website Services. The Service Transition and  Tiered Production Support teams are repurposed to concentrate solely on lower demand, on-premise applications. Website Services teams take on continual service transition and You Build It, You Run It themselves. This provokes a paradigm shift in how operability is handled at MediaTech, as Website Services teams start to implement their own telemetry and share their learnings when failures occur.

Change Management agree with the Website Services teams that any application with a deployment pipeline and automated rollback can move to Standard Change after 3 successful Normal Changes. In addition, agreement is reached on experimental, team-approved Normal Changes. Applications with the Standard Change entry criteria and have passed all operational checks no longer require CAB approval for irregular changes.

The elimination of handoffs and rework between Website Services and Operations teams means videogames-ui and videogames-ui deployment frequency can be increased to every 5 days. The applications are finally in a state of Continuous Delivery, and the next round of improvements can begin elsewhere in the MediaTech estate.

This is part 5 of the Strategising for Continuous Delivery series

  1. Strategising for Continuous Delivery
  2. The Bimodal Delusion
  3. Multi-Demand IT
  4. Multi-Demand Architecture
  5. Multi-Demand Operations

Acknowledgements

Thanks to Thierry de Pauw for reviewing this series.

Multi-Demand Architecture

How can Multi-Demand Architecture accelerate reliability and delivery flow? Why should Policy Rules be based on Continuous Delivery predictors? What is the importance of a loosely-coupled architecture? How can architectural Policy Rules benefit Continuous Delivery and reliability

This is Part 4 of the Strategising for Continuous Delivery series

Increase flow with policies

Policy Rules are not inherently bad. Some policies should be established across all demand groups, to drive Continuous Delivery adoption:

  • Software management should be based on Work In Progress (WIP) limits to reduce batch sizes, visual displays, and production feedback
  • Development should involve comprehensive version control, a loosely-coupled architecture, Trunk Based Development, and Continuous Integration
  • Testing should include developer-driven automated tests, tester-driven exploratory testing, and self-service test data

These practices have been validated in Accelerate as statistically significant predictors of Continuous Delivery. A loosely-coupled architecture is the most important, with Dr. Forsgren et al stating “high performance is possible with all kinds of systems, provided that systems – and the teams that build and maintain them – are loosely coupled”.

Design rules for loose coupling

Team and application  architectures aligned with Conway’s Law enable applications to be deployed and tested independently, even as the number of teams and applications in an organisation increases. An application should represent a Bounded Context, and be an independently deployable unit.

The reliability level of an application cannot exceed the lowest reliability level of its hard dependencies. In particular, the reliability of an application in a lower demand group may be limited by an on-premise runtime environment. Therefore, a Policy Rule should be introduced to reduce coupling between applications, particularly those in different demand groups.

Data should be stored in the same demand group as its consumers, with an asynchronous push if it continues to be mastered in a lower demand group. Interactions between applications should be protected with stability patterns such as Circuit Breakers and Bulkheads. This will allow teams to shift from Optimising For Robustness to Optimising For Resilience, and achieve new levels of reliability.

Example – MediaTech

At MediaTech, there is a commitment to re-architecting video game dataflows. An asynchronous data push is built from videogames-data to a new videogames-details service, which transforms the data format and stores it in a cloud-based database. When this is used by videogames-ui, a reliability level of 99.9% is achieved. Reducing requests into the MediaTech data centre also improves videogames-ui latency and videogames-data responsiveness.

Unlock testing guidelines

Reducing coupling between applications in different demand groups also allows for context-free Policy Rules to be replaced with context-rich Policy Guidelines. Re-designing a policy previously inherited from a lower demand group can eliminate constraints in a high demand group, and result in dramatic improvements in delivery flow. A Policy Rule that all applications must do End-To-End Testing can be replaced with a Policy Guideline that high demand applications do Contract Testing, while lower demand applications continue to do End-To-End Testing. Such a Policy Guideline could be revisited later on for lower demand applications unable to meet their own throughput target.

At MediaTech, the End-To-End Testing between videogames-ui and videogames-data is stopped. Website Services teams take on more testing responsibilities, with Contract Testing used for the videogames-data asychronous data push. Eliminating testing handoffs increases videogames-ui deployment frequency to every 10 days, but every 7 days remains unattainable due to operational handoffs.

This is part 4 of the Strategising for Continuous Delivery series

  1. Strategising for Continuous Delivery
  2. The Bimodal Delusion
  3. Multi-Demand IT
  4. Multi-Demand Architecture
  5. Multi-Demand Operations

Acknowledgements

Thanks to Thierry de Pauw for reviewing this series.

Multi-Demand IT

What is Multi-Demand IT? How does it provide the means to drive a Continuous Delivery programme with incremental investments, according to product demand?

This is Part 3 of the Strategising for Continuous Delivery series

Introduction

Multi-Demand IT is a transformation strategy that recommends investing in groups of technology value streams, according to their product demand. While Bimodal IT recommends upfront, capital investments based on an architectural division of applications, Multi-Demand favours gradual investments in Continuous Delivery across an IT estate based on product Cost of Delay.

A technology value stream is a sequence of activities that converts product ideas into value-adding changes. A demand group is a set of applications in one or more technology value streams, with a shared throughput target that must be met for Continuous Delivery to be achieved. There may also be individual reliability targets for applications within a group, based on their criticality levels.

Uncover demand groups

An IT department should have at least three demand groups representing high, medium, and low throughput targets. This links to Dr. Nicole Forsgren’s research in The Role of Continuous Delivery in IT and Organizational Performance, and Simon Wardley’s Pioneers, Settlers, and Town Planners model in The Only Structure You’ll Ever Need. Additional demand groups representing very high and very low throughput targets may emerge over time. Talented, motivated people are needed to implement Continuous Delivery within the unique context of each demand group.

Multi-Demand creates a Continuous Delivery investment language. Demand groups make it easier to prioritise which applications are in a state of Discontinuous Delivery, and need urgent improvement. The aim is to incrementally invest until Continuous Delivery is achieved for all applications in a demand group.

Applications will rarely move between demand groups. If market disruption or upstream dependents cause a surge in product demand, a rip and replace migration will likely be required as a higher demand group will have its own practices, processes, and tools. When product demand has been filled for an application, its deployment target is adjusted for a long tail of low investment. The new deployment target will retain the same lead time as before, with a lower interval. This ensures the application remains launchable on demand.

A high or medium demand group should contain a single technology value stream. This means all applications with similar demand undergo the same activities and tasks. This reduces cognitive load for teams, and ensures all applications will benefit from a single flow efficiency gain. A low demand group is more likely to have multiple technology value streams, especially if some of its applications are part of a legacy estate.

Example – MediaTech

Assume MediaTech adopts Multi-Demand for its IT transformation. There is a concerted effort to assess technology value streams, and forecast product demand. As a result, the following demand groups are created:

videogames-ui is in the sole Website Services technology value stream, while videogames-data is in one of the Heritage Applications technology value streams.

Create Multi-Demand policies

A demand group will have a policy set which determines its practices, processes, and tools. Inspired by Cynefin, a policy can be a:

  • Policy Fix: single group, such as heightened permissions for teams in a specific group
  • Policy Rule: multi-group single implementation, such as mandatory use of a central incident management system for all groups
  • Policy Guideline: multi-group multi-implementation, such as mandatory test automation with different techniques in each group

A policy will shape one or more activities and tasks within a technology value stream. Each demand group should have a minimal set of policies, as Little’s Law dictates the higher the throughput target, the fewer activities and tasks must exist. Furthermore, applying the Theory Of Constraints to Continuous Delivery shows throughput in a technology value stream will likely be constrained by the impact of a single policy on a single activity.

At MediaTech, the Multi-Demand lens shows videogames-data is in a state of Continuous Delivery while videogames-ui is in Discontinuous Delivery. This is due to the inheritance of End-To-End Testing, CAB meetings, and central production support policies from Heritage Apps, which has lower product demand and a very different context.

Policy Rules should be treated with caution, as they ignore the context and throughput target of a particular demand group. A Policy Rule can easily incur handoffs and rework that constrain throughput in a high demand group, even if it has existed for lower demand groups for years. This can be resolved by turning a Policy Rule into a Policy Guideline, and re-designing an activity per-demand. For example, End-To-End Testing might be in widespread use for all medium and low demand applications. It will likely need to be replaced with Contract Testing or similar with high demand applications.

This is Part 3 of the Strategising for Continuous Delivery series

  1. Strategising for Continuous Delivery
  2. The Bimodal Delusion
  3. Multi-Demand IT
  4. Multi-Demand Architecture
  5. Multi-Demand Operations

Acknowledgements

Thanks to Thierry de Pauw for reviewing this series.

The Bimodal delusion

Why is Bimodal IT so fundamentally flawed? Why is it just a rehash of brownfield versus greenfield IT? What is the delusion that underpins it?

This is Part 2 of the Strategising for Continuous Delivery series

Introduction

Bimodal IT is a notoriously bad method of IT transformation. In 2014, Simon Mingay and Mary Mesaglio of Gartner recommended in How to Be Digitally Agile Without Making a Mess that organisations split their IT departments in two. The authors proposed a Mode 1 for predictability and stability of traditional backend applications, and a Mode 2 for exploration and speed of digital frontend services. They argued this would allow an IT department to protect high risk, low change systems of record, while experimenting with low risk, high change systems of engagement.

Example – MediaTech

For example, a MediaTech organisation has an on-premise application estate with separate development, testing, and operations teams. Product stakeholders demand an improvement from monthly to weekly deployments and from 99.0% to 99.9% reliability, so a commitment is made to Bimodal. Existing teams continue to work in the Mode 1 on-premise estate, while new teams of developers and testers start on Mode 2 cloud-based microservices.

This includes a Mode 2 videogames-ui team, who work on a new frontend that synchronously pulls data from a Mode 1 videogames-data backend application.

Money for old rope

Bimodal is a transformation strategy framed around technology-centric choices, that recommends capital investment in systems of engagement only. It is understandable why these choices might appeal to IT executives responsible for large, mixed estates of applications. Saying Continuous Delivery is only for digital frontend services can be a rich source of confirmation bias for people accustomed to modernisation failures.

However, the truth is Bimodal is just money for old rope. The Bimodal division between Mode 1 and Mode 2 is the same brownfield versus greenfield dichotomy that has existed since the Dawn Of Computer Time. Bimodal has the exact same problems:

  • Mode 1 teams will find it hard to recruit and retain talented people
  • Mode 1 teams will trap the domain knowledge needed by Mode 2 teams
  • Mode 2 teams will depend on Mode 1 teams
  • Mode 2 services will depend on Mode 1 applications

The dependency problems are critical. Bimodal architecture is predicated on frontend services distinct from backend applications, yet the former will inevitably be coupled to the latter. A Mode 2 service will have a faster development speed than its Mode 1 dependencies, but its deployment throughput will be constrained by inherited Mode 1 practices such as End-To-End Testing and heavyweight change management. Furthermore, the reliability of a Mode 2 service can only equal its least reliable Mode 1 dependency.

At MediaTech, the videogames-ui team are beset by problems:

  • Any business logic change in videogames-ui requires End-To-End Testing with videogames-data
  • Any failure in videogames-data prevents customer purchases in videogames-ui
  • Mode 1 change management practices still apply, including CABs and change freezes
  • Mode 1 operational practices still apply, such as a separate operations team and detailed handover plans pre-release

As a result, the videogames-ui team are only able to achieve fortnightly deployments and 99.0% reliability, much to the dissatisfaction of their product manager.

The delusion

This is the Bimodal delusion – that stability and speed are a zero-sum game. As Jez Humble explains in The Flaw at the Heart of Bimodal IT, “Gartner’s model rests on a false assumption that is still pervasive in our industry: that we must trade off responsiveness against reliability”. Peer-reviewed academic research by Dr. Nicole Forsgren et al such as The Role of Continuous Delivery in IT and Organizational Performance has proven this to be categorically false. Increasing deployment frequency does not need to have a negative impact on costs, quality, or reliability.

This is Part 2 of the Strategising for Continuous Delivery series

  1. Strategising for Continuous Delivery
  2. The Bimodal Delusion
  3. Multi-Demand IT
  4. Multi-Demand Architecture
  5. Multi-Demand Operations

Acknowledgements

Thanks to Thierry de Pauw for reviewing this series.

« Older posts Newer posts »

© 2024 Steve Smith

Theme by Anders NorénUp ↑