On Tech

Tag: Cost Of Delay

The maintenance mode myth

“Over the years, I’ve worked with many organisations who transition live software services into an operations team for maintenance mode. There’s usually talk of being feature complete, of costs needing to come under control, and the operations team being the right people for BAU work. 

It’s all a myth. You’re never feature complete, you’re not measuring the cost of delay, and you’re expecting your operations team to preserve throughput, reliability, and quality on a shoestring budget.

You can ignore opportunity costs, but opportunity costs won’t ignore you.”

Steve Smith

Introduction

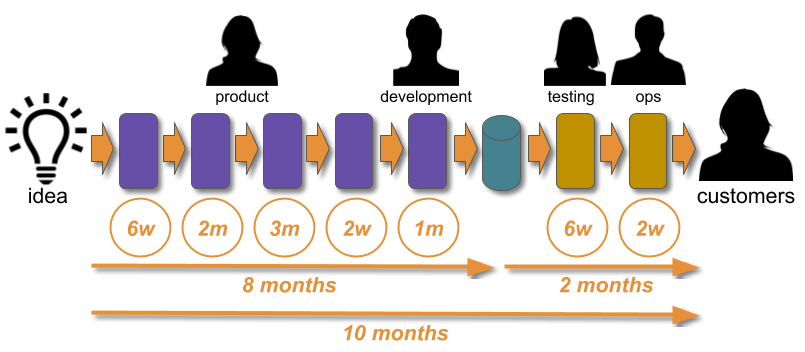
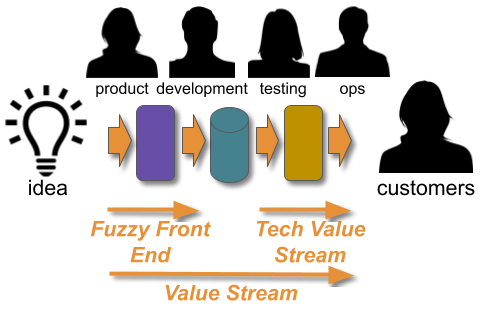
Maintenance mode is when a digital service is deemed to be feature complete, and transitioned into BAU maintenance work. Feature development is stopped, and only fixes and security patches are implemented. This usually involves a delivery team handing over their digital service to an operations team, and then the delivery team is disbanded.

Maintenance mode is everywhere that IT as a Cost Centre can be found. It is usually implemented by teams handing over their digital services to the operations team upon feature completion, and then the teams are disbanded. This happens with the Ops Run It operating model, and with You Build It You Run It as well. Its ubiquity can be traced to a myth: 

Maintenance mode by an operations team preserves the same protection for the same financial exposure

This is folklore. Maintenance mode by your operations team might produce lower run costs, but it increases the risk of revenue losses from stagnant features, operational costs from availability issues, and reputational damage from security incidents.

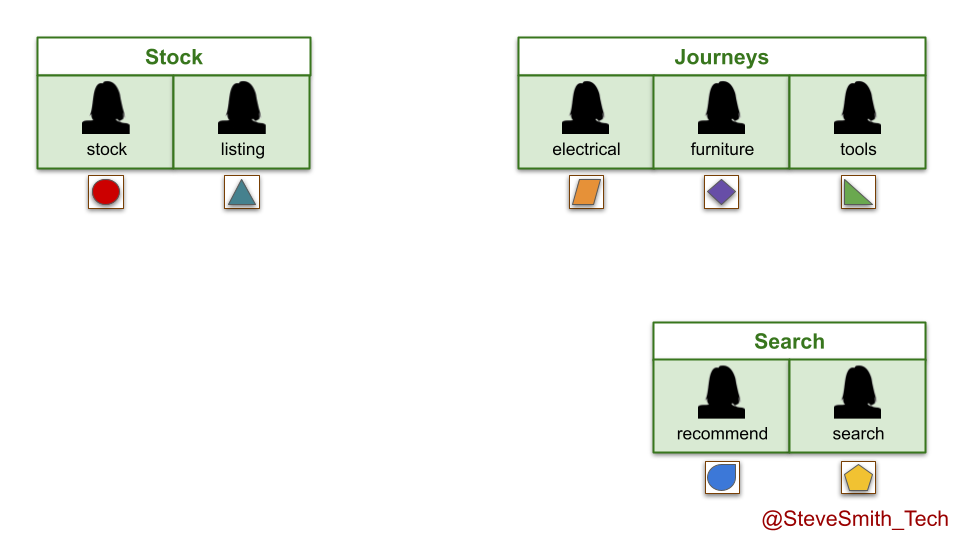
Imagine a retailer DIYers.com, with multiple digital services in multiple product domains. The product teams use You Build It You Run It, and have achieved their Continuous Delivery target measure of daily deployments. There is a high standard of quality and reliability, with incidents rapidly resolved by on-call product team engineers.

DIYers.com digital services are put into maintenance mode with the operations team after three months of live traffic. Product teams are disbanded, and engineers move into newer teams. There is an expected decrease in throughput, from daily to monthly deployments. However, there is also an unexpected decrease in quality and reliability. The operations team handles a higher number of incidents, and takes longer to resolve them than the product teams.

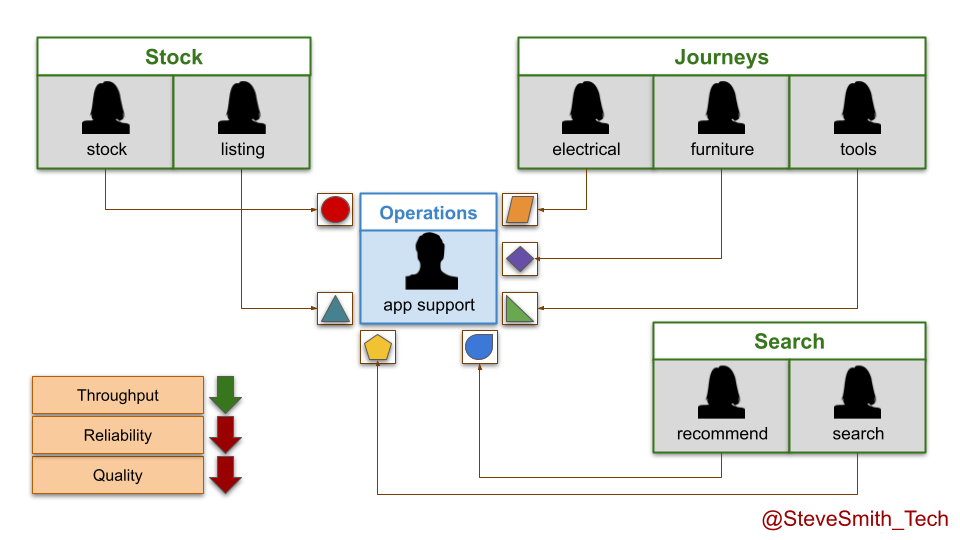
This produces some negative outcomes:

  • Higher operational costs. The reduced run costs from fewer product teams are overshadowed by the financial losses incurred during more frequent and longer periods of DIYers.com website unavailability. 
  • Lower customer revenues. DIYers.com customers are making fewer website orders than before, spending less on merchandise per order, and complaining more about stale website features. 

DIYers.com learned the hard way that maintenance mode by an operations team reduces protection, and increases financial exposure. 

Maintenance mode reduces protection

Maintenance mode by an operations team reduces protection, because it increases deployment lead times.

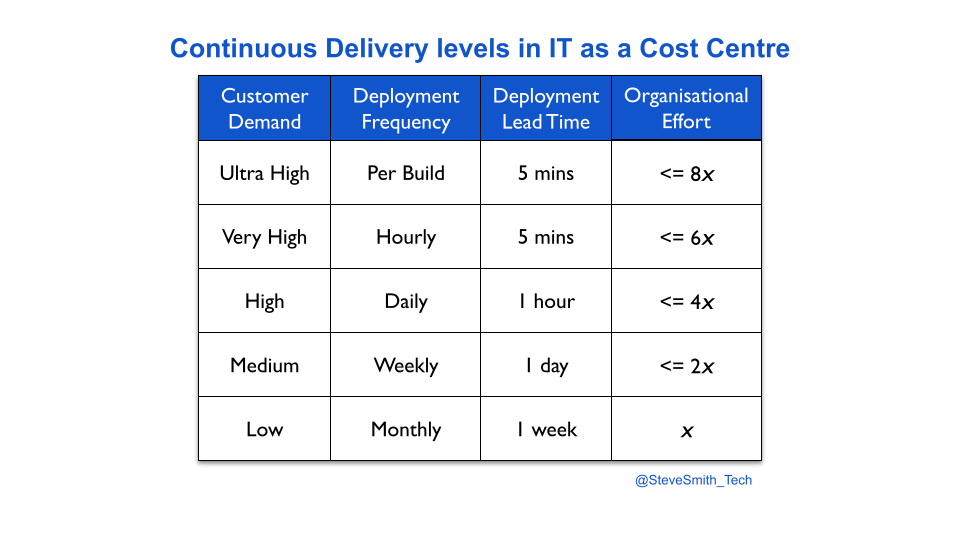
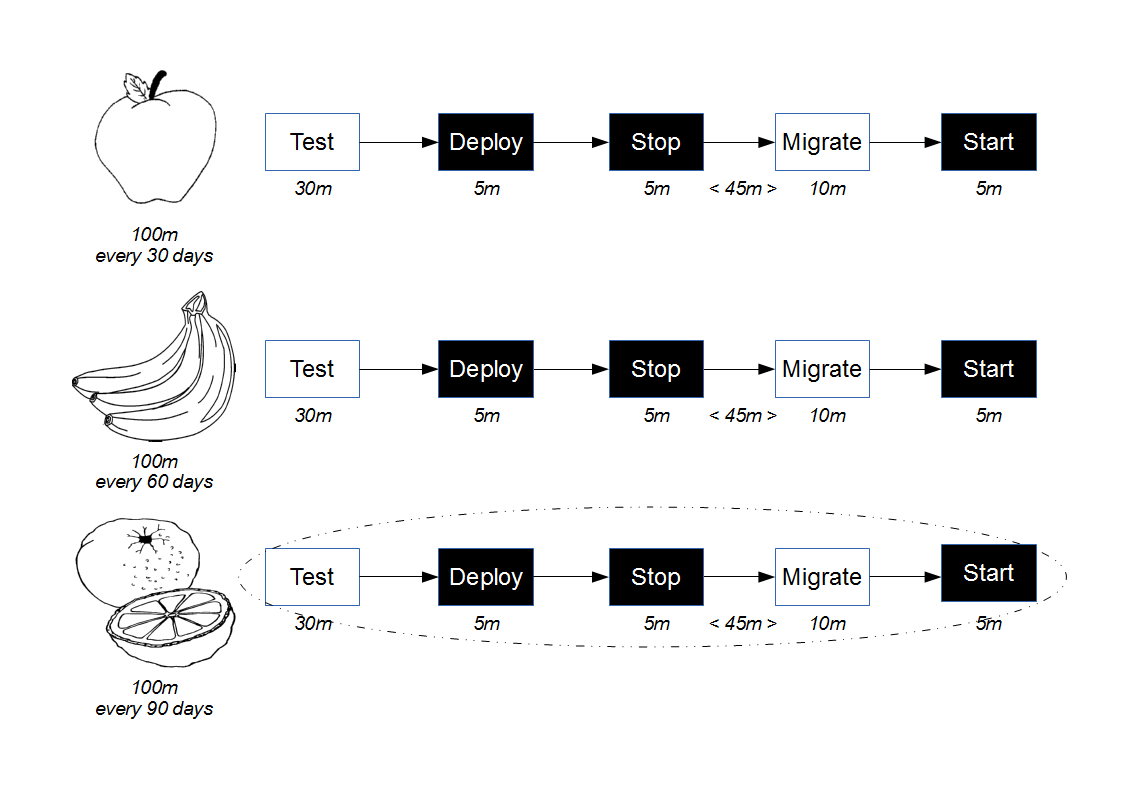
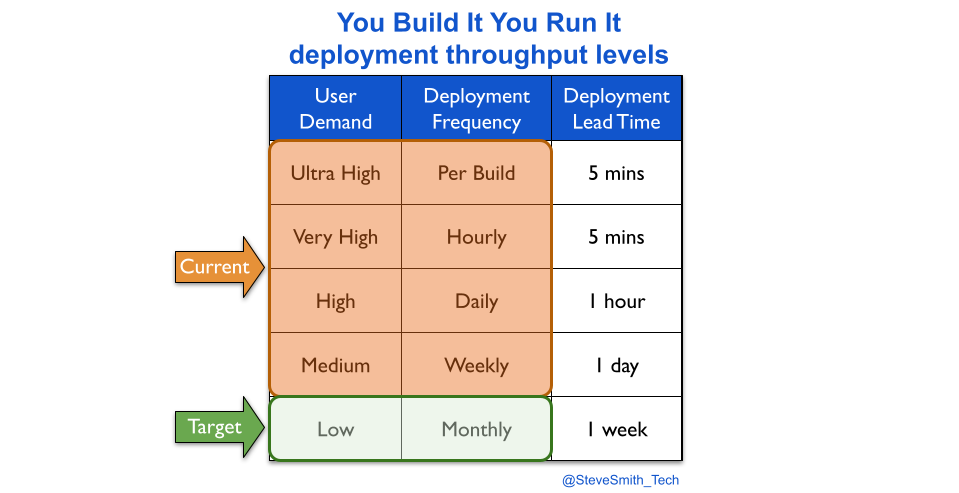
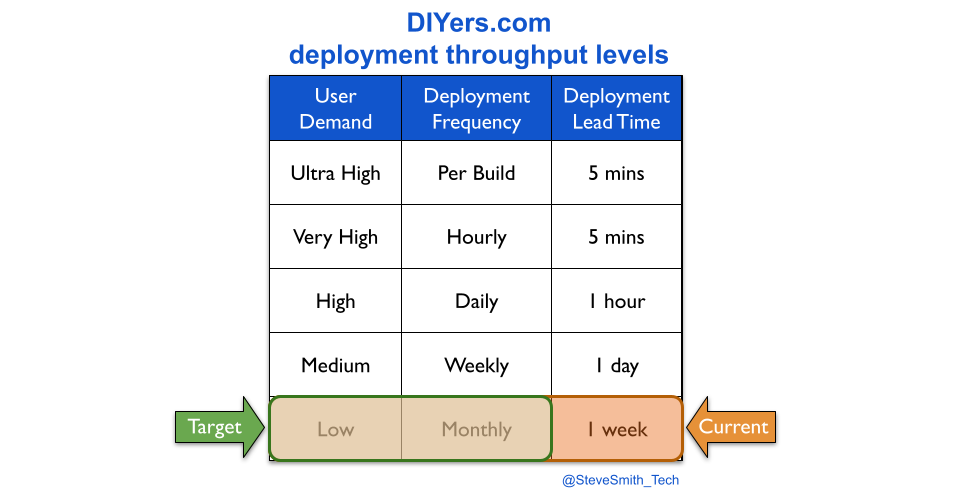
Transitioning a digital service into an operations team means fewer deployments. This can be visualised with deployment throughput levels. A You Build It You Run It transition reduces weekly deployments or more to a likely target measure of monthly deployments.

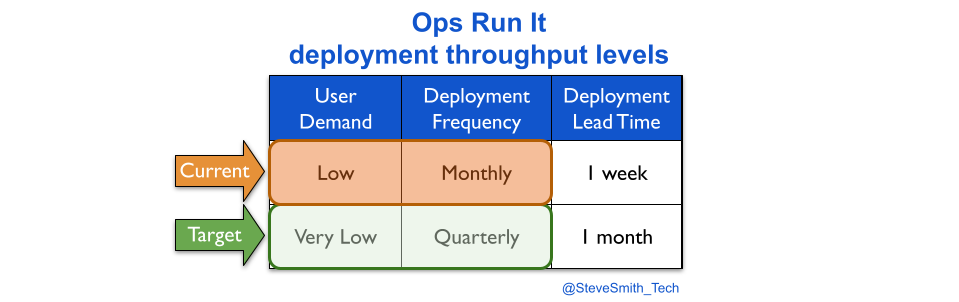
An Ops Run It transition probably reduces monthly deployments to a target measure of quarterly deployments.

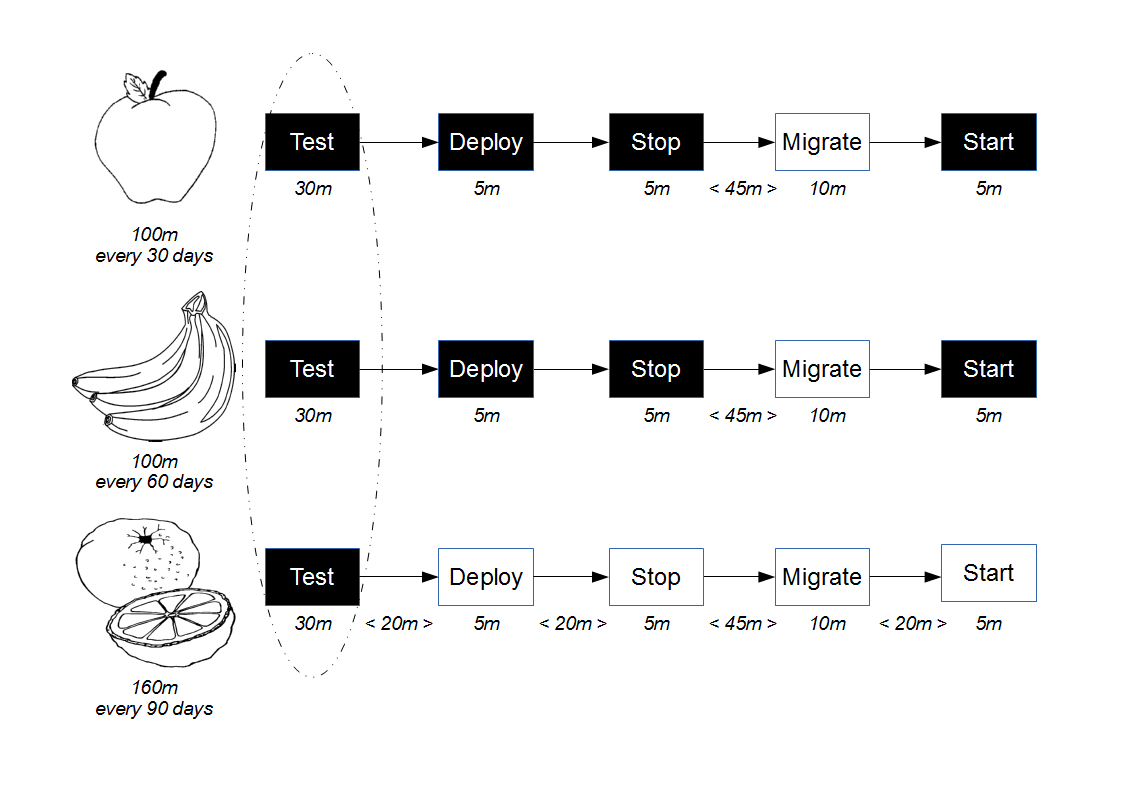
Maintenance mode also results in slower deployments. This happens silently, unless deployment lead time is measured. Reducing deployment frequency creates plenty of slack, and that additional time is consumed by the operations team building, testing, and deploying a digital service from a myriad of codebases, scripts, config files, deployment pipelines, functional tests, etc. 

Longer deployment lead times result in:

  • Lower quality. Less rigour is applied to technical checks, due to the slack available. Feedback loops become enlarged and polluted, as test suites become slower and non-determinism creeps in. Defects and config workarounds are commonplace. 
  • Lower reliability. Less time is available for proactive availability management, due to the BAU maintenance workload. More time is needed to identify and resolve incidents. Faulty alerts, inadequate infrastructure, and major financial losses upon failure become the norm.

This situation worsens at scale. Each digital service inflicted on an operations team adds to their BAU maintenance workload. There is a huge risk of burnout amongst operations analysts, and deployment lead times subsequently rising until monthly deployments become unachievable.

At DIYers.com, the higher operational costs were caused by a loss of protection. The drop from daily to monthly deployments was accompanied by a silent drop in deployment lead time from 1 hour to 1 week. This created opportunities for quality and reliability problems to emerge, and operational costs to increase.

Maintenance mode increases financial exposure

Maintenance mode by an operations team increases financial exposure, because opportunity costs are constant, and unmanageable with long deployment lead times.

Opportunity costs are constant because user needs are unbounded. It is absurd to declare a digital service to be feature complete, because user demand does not magically stop when feature development is stopped. Opportunities to profit from satisfying user needs always exist in a market. 

Maintenance mode is wholly ignorant of opportunity costs. It is an artificial construct, driven by fixed capex budgets. It is true that developing a digital service indefinitely leads to diminishing returns, and expected return on investment could be higher elsewhere. However, a binary decision to end all investment in a digital service squanders any future opportunities to proactively increase revenues. 

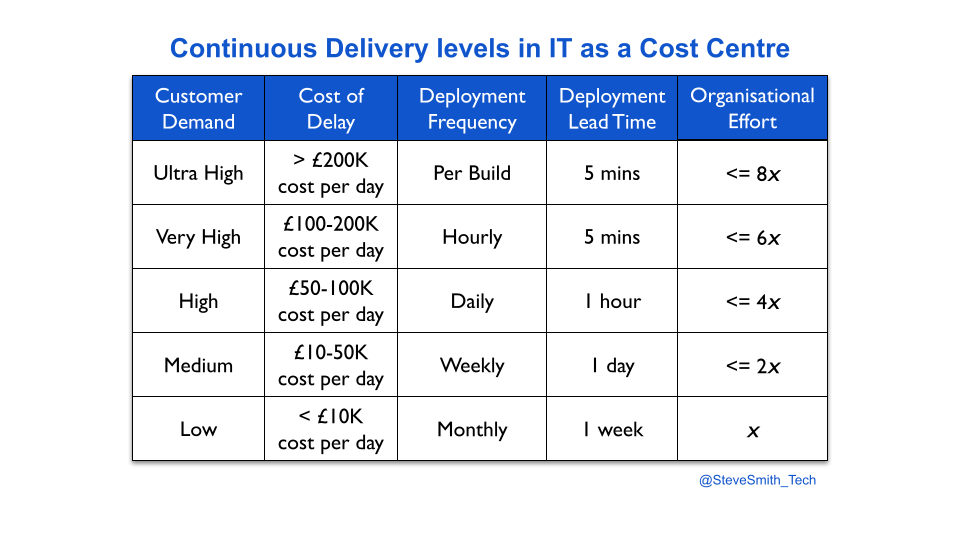
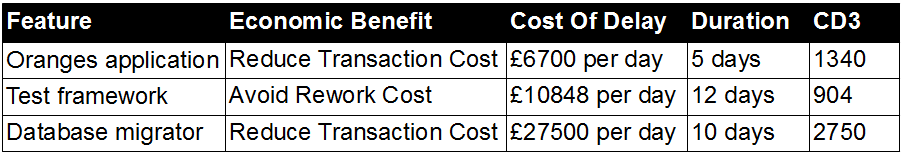
Opportunity costs are unmanageable with long deployment times, because a market can move faster than an overworked operations team. The cost of delay can be enormous if days or weeks of effort are needed to build, test, and deploy. Critical opportunities can be missed, such as:

  • Increasing revenues by building a few new features to satisfy a sudden, unforeseeable surge in user demand. 
  • Protecting revenues when a live defect is found, particularly in a key trading period like Black Friday.
  • Protecting revenues, costs, and brand reputation when a zero day security vulnerability is discovered.  

The log4shell security flaw left hundreds of millions of devices vulnerable to arbitrary code execution. It is easy to imagine operations teams worldwide, frantically trying to patch tens of different digital services they did not build themselves, in the face of long deployment lead times and the threat of serious reputational damage. 

At DIYers.com, the lower customer revenues were caused by feature stagnation. The lack of funding for digital services meant customers became dissatisfied with the DIYers.com website, and many of them shopped on competitor websites instead.

Maintenance mode is best performed by product teams

Maintenance mode is best performed by product teams, because they are able to protect the financial exposure of digital services with minimal investment. 

Maintenance mode makes sense, in the abstract. IT as a Cost Centre dictates there are only so many fixed capex budgets per year. In addition, sometimes a digital service lacks the user demand to justify continuing with a dedicated product team. Problems with maintenance mode stem from implementation, not the idea. It can be successful with the following conditions:

  1. Be transparent. Communicate maintenance mode is a consequence of fixed capex budgets, and digital services do not have long-term funding without demonstrating product/market fit e.g. with Net Promoter Score
  2. Transition from Ops Run It to You Build It You Run It. Identify any digital services owned by an operations team, and transition them to product teams for all build and run activities. 
  3. Target the prior deployment lead time. Ensure maintenance mode has a target measure of less frequent deployments and the pre-transition deployment lead time. 
  4. Make product managers accountable. Empower budget holders for product teams to transition digital services in and out of maintenance mode, based on business metrics and funding scenarios. 
  5. Block transition routes to operations teams. Update service management policies to state only self-hosted COTS and back office foundational systems can be run by an operations team. 
  6. Track financial exposure. Retain a sliver of funding for user research into fast moving opportunities, and monitor financial flows in a digital service during normal and abnormal operations. 
  7. Run maintenance mode as background tasks. Empower product teams to retain their live digital services, then transfer those services into sibling teams when funding dries up.  

Maintenance mode works best when product teams run their own digital services. If a team has a live digital service #1 and new funding to develop digital service #2 in the same product domain, they monitor digital service #1 on a daily basis and deploy fixes and patches as necessary. This gives product teams a clear understanding of the pitfalls and responsibilities of running a digital service, and how to do better in the future. 

If funding dictates a product team is disbanded or moved into a different product domain, any digital services owned by that team need to be transferred to a sibling team in the current product domain. This minimises the knowledge sharing burden and BAU maintenance workload for the new product team. It also protects deployment lead times for the existing digital services, and consequently their reliability and quality standards. 

Maintenance mode by product teams requires funding for one permanent product team in each product domain. This drives some positive behaviours in organisational design. It encourages teams working in the same product domain to be sited in the same geographic region, which encourages a stronger culture based on a shared sense of identity. It also makes it easier to reawaken a digital service, as the learning curve is much smaller when sufficient user demand is found to justify further development. 

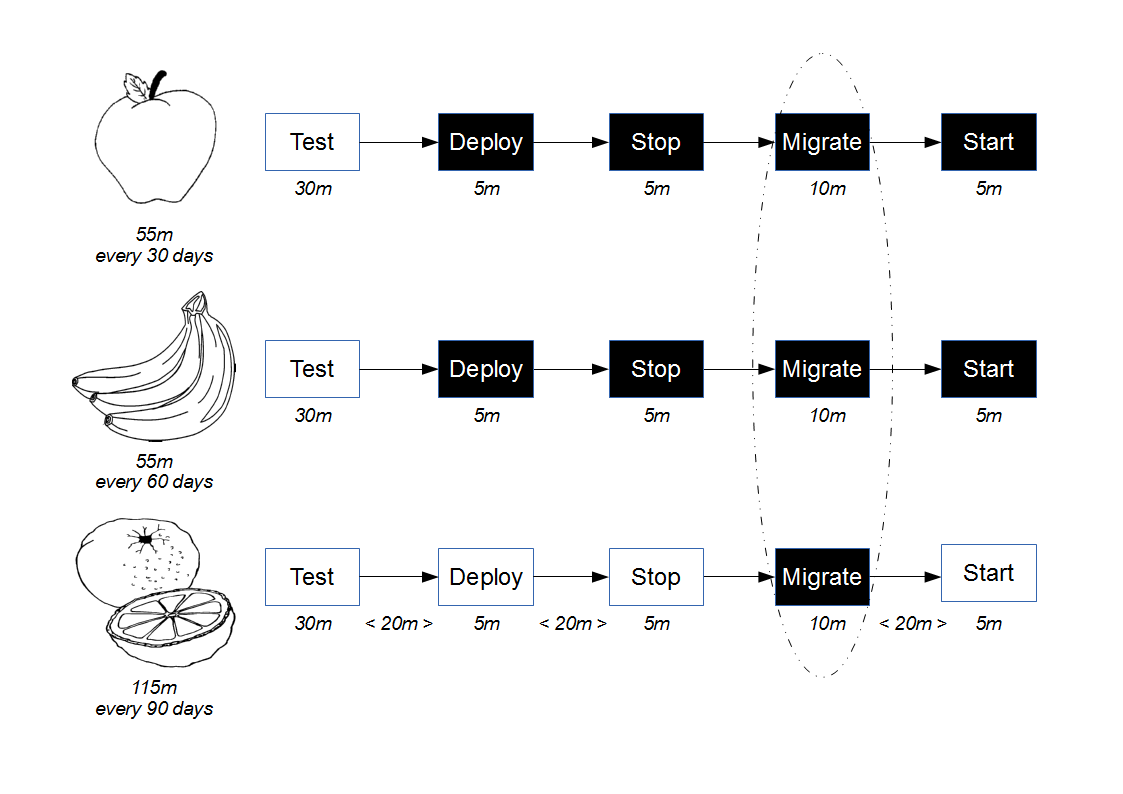
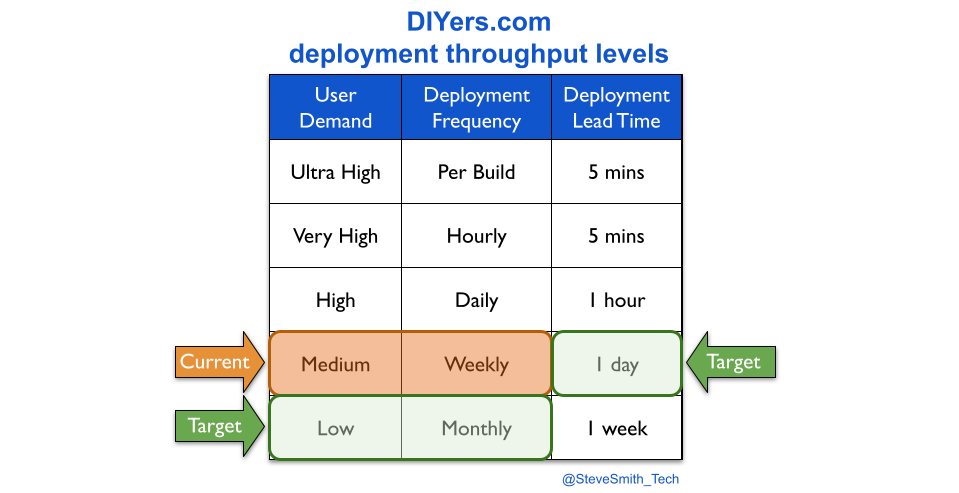
Consider DIYers.com, if maintenance mode was by owned product teams. The organisation-wide target measures for maintenance mode would be expanded, from monthly deployments to monthly deployments performed in under a day.

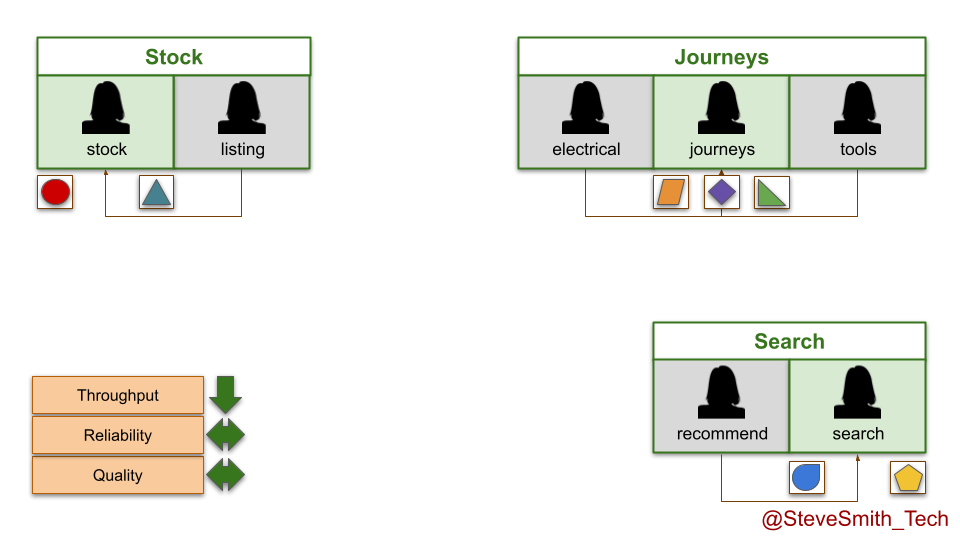
In the stock domain, the listings team is disbanded when funding ends. Its live service is moved into the stock team, and runs in the background indefinitely while development efforts continue on the stock service. The same happens in the search domain, with the recommend service moving into the search team. 

In the journeys domain, the electricals and tools teams both run out of funding. Their live digital services are transferred into the furniture team, which is renamed the journeys team and made accountable for all live digital services there. 

Of course, there is another option for maintenance mode by product teams. If a live digital service is no longer competitive in the marketplace and funding has expired, it can be deleted. That is the true definition of done.

Continuous Delivery levels

“When I’m asked how long it’ll take to implement Continuous Delivery, I used to say ‘it depends’. That’s a tough conversation starter for topics as broad as culture, engineering excellence, and urgency.

Now, I use a heuristic that’s a better starter – ‘around twice as much effort than your last step change in deployments’. Give it a try!”

Steve Smith

TL;DR:

  • Continuous Delivery is challenging and time-consuming to implement in enterprise organisations.
  • The author has an estimation heuristic that ties levels of deployment throughput with the maximum organisational effort required.
  • A product manager must choose the required throughput level for their service.
  • Cost Of Delay can be used to calculate a required throughput level.

Introduction

Continuous Delivery is about a team increasing the throughput of its deployments until customer demand is sustainably met. In Accelerate, Dr. Nicole Forsgren et al demonstrate that Continuous Delivery produces:

  • High performance IT. Better throughput, quality, and stability.
  • Superior business outcomes. Twice as likely to exceed profitability, market share, and productivity goals.
  • Improved working conditions. A generative culture, less burnout, and more job satisfaction.

If an enterprise organisation has IT as a Cost Centre, Continuous Delivery is unlikely to happen organically in one delivery team, let alone many. Systemic continuous improvement is incompatible with incentives focussed on project deadlines and cost reduction targets. Separate funding may be required for adopting Continuous Delivery, and approval may depend on an estimate of duration. That can be a difficult conversation, as the pathways to success are unknowable at the outset.

Continuous Delivery means applying a multitude of technology and organisational changes to the unique circumstances of an organisation. An organisation is a complex, adaptive system, in which behaviours emerge from unpredictable interactions between people, teams, and departments. Instead of linear cause and effect, there is a dispositional state representing a set of possibilities at that point in time. The positive and/or negative consequences of a change cannot be predicted, nor the correct sequencing of different changes.

An accurate answer to the duration of a Continuous Delivery programme is impossible upfront. However, an approximate answer is possible. 

Continuous Delivery levels

In Site Reliability Engineering, Betsey Byers et al describe reliability engineering in terms of availability levels. Based on their own experiences, they suggest ‘each additional nine of availability represents an order of magnitude improvement. For example, if a team achieves 99.0% availability with x engineering effort, an increase to 99.9% availability would need a further 10x effort from the exact same team.

In a similar fashion, deployment throughput levels can be established for Continuous Delivery. Deployment throughput is a function of deployment frequency and deployment lead time, and common time units can be defined as different levels. When linked to the relative efforts required for technology and organisational changes, throughput levels can be used as an estimation heuristic.

Based on ten years of author experiences, this heuristic states an increase in deployments to a new level of throughput requires twice as much effort as the previous level. For instance, if two engineers needed two weeks to move their service from monthly to weekly deployments, the same team would need one month of concerted effort for daily deployments.

The optimal approach to implement Continuous Delivery is to use the Improvement Kata. Improvement cycles can be executed to exploit the current possibilities in the dispositional state of the organisation, by experimenting with technology and organisational changes. The direction of travel for the Improvement Kata can be expressed as the throughput level that satisfies customer demand.

A product manager selects a throughput level based on their own risk tolerance. They have to balance the organisational effort of achieving a throughput level with predicted customer demand. The easiest way is to simply choose the next level up from the current deployment throughput, and re-calibrate level selection whenever an improvement cycle in the Improvement Kata is evaluated.

Context matters. These levels will sometimes be inaccurate. The relative organisational effort for a level could be optimistic or pessimistic, depending on the dispositional state of the organisation. However, Continuous Delivery levels will provide an approximate answer of effort immediately, when an exact answer is impossible. 

Quantifying customer demand

A more accurate, slower way to select a deployment throughput level is to quantify customer demand, via the opportunity costs associated with potential features for a service. The opportunity cost of an idea for a new feature can be calculated using Cost of Delay, and the Value Framework by Joshua Arnold et al.

First, an organisation has to establish opportunity cost bands for its deployment throughput levels. The bands are based on the projected impact of Discontinuous Delivery on all services in the organisation. Each service is assessed on its potential revenue and costs, its payment model, its user expectations, and more. 

For example, an organisation attaches a set of opportunity cost bands to its deployment throughput levels, based on an analysis of revenue streams and costs. A team has a service with weekly deployments, and demand akin to a daily opportunity cost of £20K for planned features. It took one week of effort to achieve weekly deployments. The service is due to be rewritten, with an entirely new feature set estimated to be £90K in daily opportunity costs. The product manager selects a throughput level of daily deployments, and the organisational effort is estimated to be 10 weeks.

Acknowledgements

Thanks to Alun Coppack, Dave Farley, and Thierry de Pauw for their feedback.

Build The Right Thing and Build The Thing Right

Should an organisation in peril start its journey towards IT enabled growth by investing in IT delivery first, or product development? Should it Build The Thing Right with Continuous Delivery first, or Build The Right Thing with Lean Product Development?

Introduction

The software revolution has caused a profound economic and technological shift in society. To remain competitive, organisations must rapidly explore new product offerings as well as exploiting established products. New ideas must be continuously validated and refined with customers, if product/market fit and repeatable sales are to be found.

That is extremely difficult when an organisation has the 20th century, pre-Internet IT As A Cost Centre organisational model. There will be a functionally segregated IT department, that is accounted for as a cost centre that can only incur costs. There will be an annual plan of projects, each with its scope, resources, and deadlines fixed in advance. IT delivery teams will be stuck in long-term Discontinuous Delivery, and IT executives will only be incentivised to meet deadlines and reduce costs.

If product experimentation is not possible and product/market fit for established products declines, overall profitability will suffer. What should be the first move of an organisation in such perilous conditions? Should it invest first in Lean Product Development to Build The Right Thing, and uncover new product offerings as quickly as possible? Or should it invest in Continuous Delivery to Build The Thing Right first, and create a powerful growth engine for locating future product/market fit?

Build The Thing Right first

In 2007, David Shpilberg et al published a survey of ~500 executives in Avoiding the Alignment Trap in IT. 74% of respondents reported an under-performing, undervalued IT department, unaligned with business objectives. 15% of respondents had an effective IT department, with variable business alignment, below average IT spending, and above average sales growth. Finally, 11% were in a so-called Alignment Trap, with negative sales growth despite above average IT spending and tight business alignment.

Avoiding the alignment trap in IT

Avoiding the Alignment Trap in IT (Shpilberg et al) – source praqma.com

Shpilberg et al report “general ineffectiveness at bringing projects in on time and on the dollar, and ineffectiveness with the added complication of alignment to an important business objective”. The authors argue organisations that prematurely align IT with business objectives will fall into an Alignment Trap. They conclude organisations should build a highly effective IT department first, and then align IT projects to business objectives. In other words, Build The Thing Right before trying to Build The Right Thing.

The conclusions of Avoiding the Alignment Trap in IT are naive, because they ignore the implications of IT As A Cost Centre. An organisation with ineffective IT will undoubtedly suffer if it increases business alignment and investment in IT as is. However, that is a consequence of functionally siloed product and IT departments, and the antiquated project delivery model tied to IT As A Cost Centre. Projects will run as a Large Batch Death Spiral for months without customer feedback, and invariably result in a dreadful waste of time and money. When Shpilberg et al define success as “delivered projects with promised functionality, timing, and cost”, they are measuring manipulable project outputs, rather than customer outcomes linked to profitability.

Build The Right Thing first

It is hard to Build The Right Thing without first learning to Build The Thing Right, but it is possible. If flow is improved through co-dependent product and IT teams, the negative consequences of IT As A Cost Centre can be reduced. New revenue streams can be unlocked and profitability increased, before a full Continuous Delivery programme can be completed.

An organisation will have a number of value streams to convert ideas into product offerings. Each value stream will have a Fuzzy Front End of product and development activities, and a technology value stream of build, testing, and operational activities. The time from ideation to customer is known as cycle time.

Flow in a value stream can be improved by:

  • understanding the flow of ideas
  • reducing batch sizes
  • quantifying value and urgency

The flow of ideas can be understood by conducting a Value Stream Mapping with senior product and IT stakeholders. Visualising the activities and teams required for ideas to reach customers will identify an approximate cycle time, and the sources of waste that delay feedback. A Value Stream Mapping will usually uncover a shocking amount of rework and queue times, with the majority in the Fuzzy Front End.

For example, a Value Stream Mapping might reveal a 10 month cycle time, with 8 months spent on ideas bundled up as projects in the Fuzzy Front End, and 2 months spent on IT in the technology value stream. Starting out with Build The Thing Right would only tackle 20% of cycle time.

Reducing batch sizes means unbundling projects into separate features, reducing the size of features, and using Work In Process (WIP) Limits across product and IT teams. Little’s Law guarantees distilling projects into small, per-feature deliverables and restricting in-flight work will result in shorter cycle times. In Lean Enterprise, Jez Humble, Joanne Molesky, and Barry O’Reilly describe reducing batch sizes as “the most important factor in systemically increasing flow and reducing variability”.

Quantifying value and urgency means working with product stakeholders to estimate the Cost Of Delay of each feature. Cost Of Delay is the economic benefit a feature could generate over time, if it was available immediately. Considering how time will affect how a feature might increase revenue, protect revenue, reduce costs, and/or avoid costs is extremely powerful. It encourages product teams to reduce cycle time by shrinking batch sizes and eliminating Fuzzy Front End activities. It uncovers shared assumptions and enables better trade-off decisions. It creates a shared sense of urgency for product and IT teams to quickly deliver high value features. As Don Reinertsen says in the The Principles of Product Development Flow, “if you only measure one thing, measure the Cost Of Delay”.

For example, a manual customer registration task generates £100Kpa of revenue, and is performed by one £50Kpa employee. The economic benefit of automating that task could be calculated as £100Kpa of revenue protection and £50Kpa of cost reduction, so £5.4Kpw is lost while the feature does not exist. If there is a feature with a Cost Of Delay greater than £5.4Kpw, the manual task should remain.

Build The Right Thing case study – Maersk Line

Black Swan Farming – Maersk Line by Joshua Arnold and Özlem Yüce demonstrates how an organisation can successfully Build The Right Thing first, by understanding the flow of ideas, reducing batch sizes, and quantifying value and urgency. In 2010, Maersk Line IT was a £60M cost centre with 20 outsourced development teams. Between 2008 and 2010 the median cycle time in all value streams was 150 days. 62% of ~3000 requirements in progress were stuck in Fuzzy Front End analysis.

Arnold and Yüce were asked to deliver more value, flow, and quality for a global booking system with a median cycle time of 208 days, and quarterly production releases in IT. They mapped the value stream, shrank features down to the smallest unit of deliverable value, and introduced Cost Of Delay into product teams alongside other Lean practices.

After 9 months, improvements in Fuzzy Front End processes resulted in a 48% reduction in median cycle time to 108 days, an 88% reduction in defect count, and increased customer satisfaction. Furthermore, using Cost Of Delay uncovered 25% of requirements were a thousand times more valuable than the alternatives, which led to a per-feature return on investment six times higher than the Maersk Line IT average. By applying the same Lean principles behind Continuous Delivery to product development prior to additional IT investment, Arnold and Yüce achieved spectacular results.

Build The Right Thing and Build The Thing Right

If an organisation in peril tries to Build The Right Thing first, it risks searching for product/market fit without the benefits of fast customer feedback. If it tries to Build The Thing Right first, it risks spending time and money on Continuous Delivery without any tangible business benefits.

An organisation should instead aim to Build The Right Thing and Build The Thing Right from the outset. A co-evolution of product development and IT delivery capabilities is necessary, if an organisation is to achieve the necessary profitability to thrive in a competitive market.

This approach is validated by Dr. Nicole Forsgren et al in Accelerate. Whereas Avoiding The Alignment Trap In IT was a one-off assessment of business alignment in IT As A Cost Centre, Accelerate is a multi-year, scientifically rigorous study of thousands of organisations worldwide. Interestingly, Lean product development is modelled as understanding the flow of work, reducing batch sizes, incorporating customer feedback, and team empowerment. The data shows:

  • Continuous Delivery and Lean product development both predict superior software delivery performance and organisational culture
  • Software delivery performance and organisational culture both predict superior organisational performance in terms of profitability, productivity, and market share
  • Software delivery performance predicts Lean product development

On the reciprocal relationship between software delivery performance and Lean product development, Dr. Nicole Forsgren et al conclude “the virtuous cycle of increased delivery performance and Lean product management practices drives better outcomes for your organisation”.

Exapting product development and technology

An organisational ambition to Build The Right Thing and Build The Thing Right needs to start with the executive team. Executives need to recognise an inability to create new offerings or protect established products equates to mortal peril. They need to share a vision of success with the organisation that articulates the current crisis, describes a state of future prosperity, and injects urgency into day-to-day work.

The executive team should introduce the Improvement Kata into all levels of the organisation. The Improvement Kata encourages problem solving via experimentation, to proceed towards a goal in iterative, incremental steps amid ambiguities, uncertainties, and difficulties. It is the most effective way to manage a gradual co-emergence of Lean Product Development and Continuous Delivery.

Experimentation with organisational change should include a transition from IT As A Cost Centre to IT As A Business Differentiator. This means technology staff moving from the IT department to work in long-lived, outcome-oriented teams in one or more product departments, which are accounted for as profit centres and responsible for their own investment decisions. One way to do this is to create a Digital department of co-located product and technology staff, with shared incentives to create new product offerings. Handoffs and activities in value streams will be dramatically reduced, resulting in much faster cycle times and tighter customer feedback loops.

Instead of an annual budget and a set of fixed scope projects, there needs to be a rolling budget that funds a rolling plan linked to desired outcomes and strategic business objectives. The scope, resources, and deadlines of the rolling plan should be constantly refined by validated learnings from customers, as delivery teams run experiments to find problem/solution fit and problem/market for a particular business capability.

Those delivery teams should be cross-functional, with all the necessary personnel and skills to apply Design Thinking and Lean principles to problem solving. This should include understanding the flow of ideas, reducing batch sizes, and the quantifying value and urgency. As Lean Product Development and Continuous Delivery capabilities gradually emerge, it will become much easier to innovate with new product offerings and enhance established products.

It might take months or years of investment, experimentation, and disruption before an organisation has adopted Lean Product Development and Continuous Delivery across all its value streams. It is important to protect delivery expectations and staff welfare by making changes one value stream at a time, by looking for existing products or new product offerings stuck in Discontinuous Delivery.

Acknowledgements

Thanks to Emily Bache, Ozlem Yuce, and Thierry de Pauw for reviewing this article.

Further Reading

  1. Lean Software Development by Mary and Tom Poppendieck
  2. Designing Delivery by Jeff Sussna
  3. The Essential Drucker by Peter Drucker
  4. Measuring Continuous Delivery by Steve Smith
  5. The Cost Centre Trap by Mary Poppendieck
  6. Making Work Visible by Dominica DeGrandis

IT as a Business Differentiator

How can Continuous Delivery power innovation in an organisation?

When an organisation is in a state of Continuous Delivery, its technology strategy can be described as IT as a Business Differentiator. IT staff will work in one or more product departments, which are accounted for as profit centres in which profits are generated from incoming revenues and outgoing costs. A profit centre provides services to customers, and is responsible for its own investment decisions and profitability.

IT as a Business Differentiator promotes IT to be a front office function. There will be a rolling budget, and a rolling plan consisting of dynamic product areas with scope, resources, and deadlines constantly refined by feedback. Long-lived, outcome-oriented delivery teams will implement experiments to find product/market fit for a particular business capability.

This is in direct contrast to Nicholas Carr’s 2003 proclamation that IT Doesn’t Matter, to which history has not been kind. Carr failed to predict the rise of Agile Development, Lean Product Development, and in particular Cloud Computing, which has commoditised many lower-order technology functions. These advancements have contributed to the ongoing software revolution termed “Software Is Eating The World” by Marc Andreessen in 2011, which has caused a profound economic and technological shift in society.

Continuous Delivery as the norm

IT as a Business Differentiator is an Internet-inspired, 21st century technology strategy in which IT contributes to uncovering new revenue streams that increase overall profitability for an organisation. This means executives and managers are incentivised to maximise revenue generating activities, as well as controlling cost generating activities.

Continuous Delivery is table stakes for IT as a Business Differentiator, as IT executives and managers are accountable for delays between ideation and customer launch. There will be an ongoing investment in technology and organisational change, to ensure deployment throughput meets market demand. There will be a focus on optimising flow by eliminating handoffs, reducing work in progress, and removing wasteful activities. The reliability strategy will be to Optimise For Resilience, in order to minimise failure response time and blast radius.

IT as a Business Differentiator and Continuous Delivery were validated by Dr. Nicole Forsgren et al, in the 2018 book Accelerate. Surveys of 23,000 people working at 2,000 organisations worldwide revealed:

  • Continuous Delivery results in high performance IT
  • High performance IT leads to simultaneous improvements in the stability and throughput of IT delivery, without trade-offs
  • High performance IT means an organisation is twice as likely to exceed profitability, market share, and productivity goals
  • Continuous Delivery also results in less rework, an improved organisational culture, reduced team burnout, and increased job satisfaction

Leaving IT As A Cost Centre

If an organisation has institutionalised IT as a Cost Centre as its technology strategy, moving to IT as a Business Differentiator would be difficult. It would require an executive-level decision, in one of the following scenarios:

  • Competition – rival organisations are increasing their market share
  • Cognition – IT is recognised as the engine of future business growth
  • Catastrophe – a serious IT failure has an enormously negative financial impact

If the executive leadership of the organisation agree there is an existential crisis, they should publicly commit to IT as a Business Differentiator. That should include an ambitious vision of success that explains the current crisis, describes a state of future economic prosperity, and injects a sense of urgency into the day-to-day work of personnel.

There is no recipe for moving from IT as a Cost Centre to IT as a Business Differentiator. As a complex, adaptive system, an organisation will have a dispositional state of time-dependent possibilities, rather than linear cause and effect. A continuous improvement method such as the Improvement Kata should be used to experiment with different changes. Experiments could include:

  • co-locating IT delivery teams with their product stakeholders
  • removing cost accounting metrics from IT executive incentives
  • creating a Digital department of product and IT staff, as a profit centre

This leaves the open question of whether an IT department should adopt Continuous Delivery before, during, or after a move from IT as a Cost Centre to IT as a Business Differentiator.

Further Reading

  1. The Principles Of Product Development Flow by Don Reinertsen
  2. Measuring Continuous Delivery by the author
  3. Lean Enterprise by Jez Humble, Joanne Molesky, and Barry O’Reilly
  4. Utility vs. Strategic Dichotomy by Martin Fowler
  5. Products Not Projects by Sriram Narayan

Acknowledgements

Thanks to Thierry de Pauw for his feedback.

Continuous Delivery and Cost of Delay

Use Cost of Delay to value Continuous Delivery features

When building a Continuous Delivery pipeline, we want to value and prioritise our backlog of planned features to maximise our return on investment. The time-honoured, ineffective IT approach of valuation by intuition and prioritisation by cost is particularly ill-suited to Continuous Delivery, due to its focus upon one-off infrastructure improvements to enable product flow. How can we value and prioritise our backlog of planned pipeline features to maximise economic benefits?

To value our backlog, we can calculate the Cost of Delay of each feature – its economic value over a period of time if it was immediately available. Described by Don Reinertsen as “the golden key that unlocks many doors“, Cost of Delay can be calculated by quantifying the value of change or the cost of the status quo via the following economic benefit types:

  • Increase Revenue – improve profit margin
  • Protect Revenue – sustain profit margin
  • Reduce Costs – reduce costs currently incurred
  • Avoid Costs – reduce costs potentially incurred

Cost of Delay allows us to quantify the opportunity cost between a feature being available now or later, and using money as the unit of measurement transforms stakeholder conversations from cost-cutting to delivering value. Calculation accuracy is less important than the process of collaborative information discovery, with assumptions and probabilities preferably co-owned by stakeholders and published via information radiator.

Cost of Delay = economic value over time if immediately available

To prioritise our backlog, we can use Cost of Delay Divided By Duration (CD3) – a variant of the Weighted Shortest Job First scheduling policy. With CD3 we divide Cost of Delay by duration, with a higher score resulting in a higher priority. This is an effective scheduling policy as the duration denominator promotes batch size reduction.

CD3 = Cost of Delay / Duration

As the goal of Continuous Delivery is to decrease cycle time by reducing the transaction cost of releasing software, a pipeline feature will likely yield an Avoid Cost or Reduce Cost benefit intrinsically linked to release cadence. We can therefore calculate the Cost of Delay as one of the below:

  1. Reduce Cost: Automate action(s) to decrease wait times within release processing time

    = (wait time in minutes / cycle time in days) * minute price in £

  2. Avoid Cost: Automate action(s) to decrease probability of repeating release processing time due to rework

    = (processing time in minutes / cycle time in days) * minute price in £ * % cost probability per year

For example, consider an organisation building a Continuous Delivery pipeline to support its Apples, Bananas, and Oranges applications by fully automating its release scripts. The rate of business change is variable, with an Apples cycle time of 1 month, a Bananas cycle time of 2 months, and an Oranges cycle time of 3 months. Our pipeline has already fully automated the deploy, stop, and start actions for our Apples and Bananas applications but lacks support for our Oranges application, our test framework, and our database migrator.
Application Estate Once our development team have provided their cost estimates, how do we determine which feature to implement next without resorting to intuition?

Backlog Duration We begin by agreeing with our pipeline stakeholders an arbitrary price for a minute of our time of £10000, and calculate the Cost of Delay for supporting the Oranges application as:
Support Oranges application

= (wait time / cycle time) * minute price
= (20 + 20 + 20 / 90) * 10000
= 0.67 * 10000
= £6700 per day

Given the test framework has failed twice in the past year and caused a repeat of release processing time specifically due to its lack of pipeline support, the Cost of Delay is:
Support test framework

= (100 / months in a year) * occurrences
= (100 / 12) * 2
= 16% cost probability per year

= (processing time / cycle time) * minute price * % cost probability
= ((100 / 30) + (100 / 60) + (160 / 90)) * 10000 * 16%
= 6.78 * 10000 * 16%
= £10848 per day (£5328 Apples, £2672 Bananas, £2848 Oranges)

The Cost of Delay for supporting the database migrator is:

Support database migrator

= (wait time / cycle time) * minute price
= ((45 / 30) + (45 / 60) + (45 / 90)) * 10000
= 2.75 * 10000
= £27500 per day (£15000 Apples, £7500 Bananas, £5000 Oranges)

Now that we have established the value of the planned pipeline features, we can use CD3 to produce an optimal work queue. CD3 confirms that support for the database migrator is our most urgent priority:

Backlog CD3

This example shows that using Cost of Delay and CD3 within Continuous Delivery validates Mary Poppendieck’s argument that “basing development decisions on economic models helps the development team make good tradeoff decisions“. As well as learning support for the database migrator is twice as valuable as any current alternative, we can offer new options to our pipeline stakeholders – for example, if an Apples-specific database migrator required only 5 days, it would become our most desirable feature (£15000 per day / 5 days = CD3 score of 3000).

© 2024 Steve Smith

Theme by Anders NorénUp ↑